
The lid · When I drink
A circular record of time, tea type, and caffeine.
How to read it
The lid functions as a 24-hour clock. Symbols distinguish teas, while concentric rings indicate caffeine levels.
Data rendered as functional objects — a tray, cups, saucer, spoon and box that each encode information.


MICA · Physical data visualization
How can an everyday ritual reveal a larger story? I combined a month of tea-drinking observations with research into tea’s global history and economy, translating the data into a set of physical objects.
Tea connects sensory experience, personal habit, and global trade. I wanted to bring those scales together in a form that invited close observation.
The design challenge was deciding what to include—and how to make different kinds of information readable through color, symbols, carved lines, and the shapes of familiar objects.
The outcome
The ceramic cup, lid, and saucer describe my own tea-drinking patterns. The tray, scoop, and box place that personal experience within a wider story of production, consumption, and history.
A circular record of time, tea type, and caffeine.
The lid functions as a 24-hour clock. Symbols distinguish teas, while concentric rings indicate caffeine levels.
Flavor, tea classification, and preference share one surface.
Each stalk represents a cup of tea. Symbols at the top record flavors; a symbol at the bottom identifies the tea classification. Stalk length expresses my level of enjoyment.
Steeping temperature and time become lines of marks.
Position around the rim indicates infusion temperature. Each dot represents 15 seconds; slashes separate successive infusions. A full line follows repeated infusions of the same leaves.
Colored bands connect where tea is produced with where it is consumed.
Each band represents a world region. The left side shows production and the right side shows consumption, making the relationship visible across the tray.
A timeline follows tea’s spread between regions.
Colored bands represent regions, black lines mark time, and dots indicate movement from one region to another.
Repeated dots make the scale of tea consumption tangible.
The dot-covered surface relates an individual cup to the much larger volume of tea consumed worldwide.
Research & framing
My interest began with the experience of drinking tea: its flavors, its associations, and the pause it creates in a day. The research expanded from my own habits to the systems and histories behind them.
Over a month, I collected data from myself and willing participants: tea type, time of day, steeping time and temperature, repeated infusions, flavors, aromas, and impressions.
I researched tea’s history, production, consumption, and chemistry, looking for connections between a personal practice and a worldwide industry.
A simple survey and responses from tea communities helped me explore why people drink tea and the words, feelings, and associations they attach to it.
Project research included the Food and Agriculture Organization of the United Nations, GeoJournal, Critical Reviews in Plant Sciences, direct observation, and self-reported data. The finished objects reflect the research and observations gathered for this project.
Exploration & iteration
The final set grew out of several different approaches. Each experiment helped me test what the data could communicate—and where the visual language became too complicated.
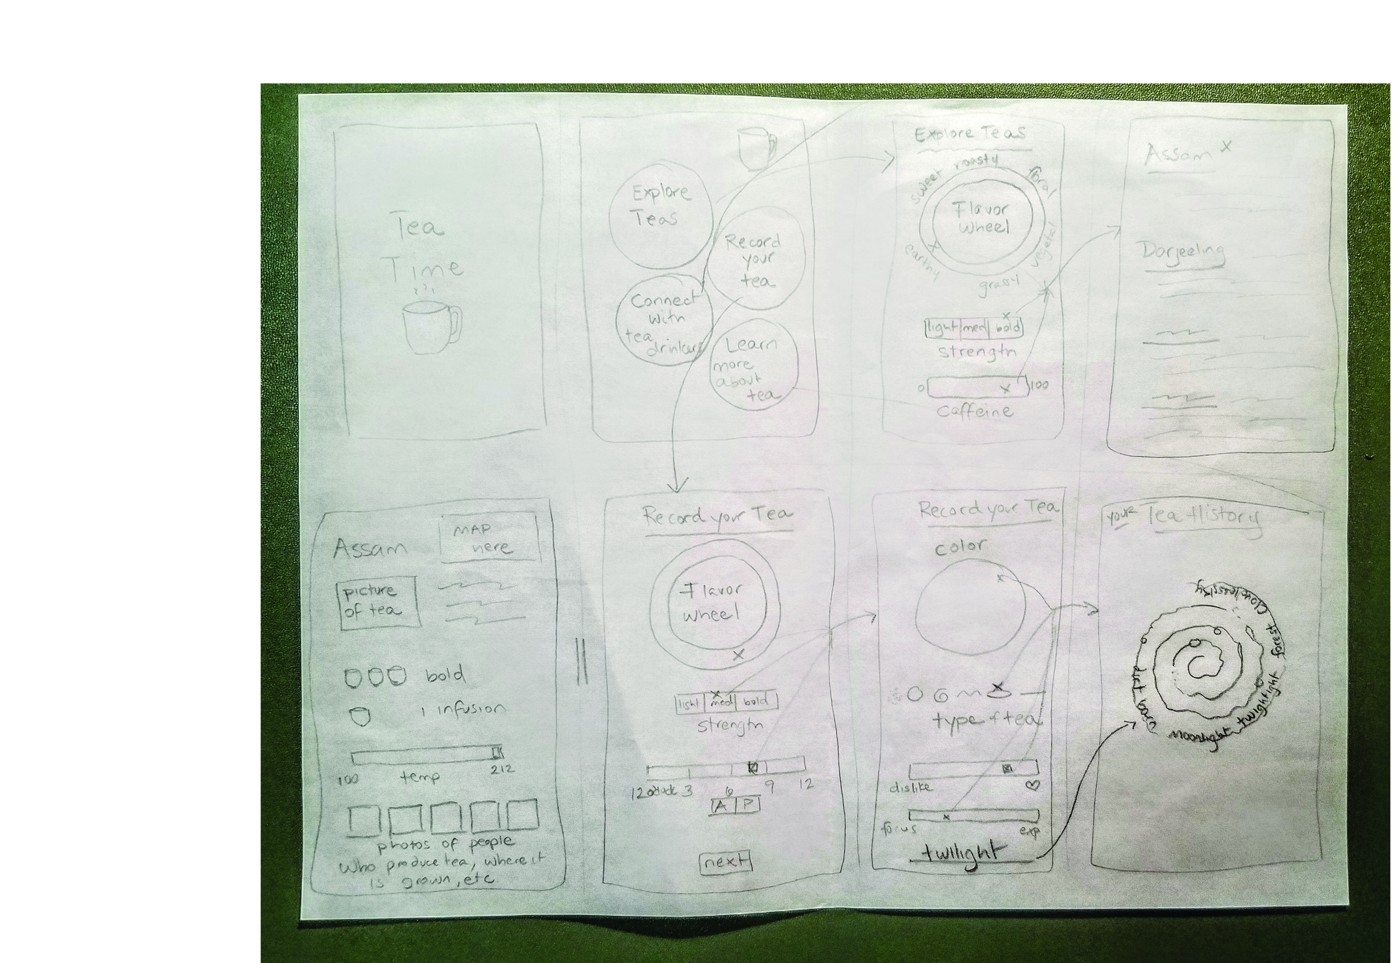
I first explored an app for recording and discovering teas. Sketches and prototypes considered flavor, strength, brewing conditions, and personal impressions.
What it revealed: The project was as much about the experience of tea as it was about recording information.
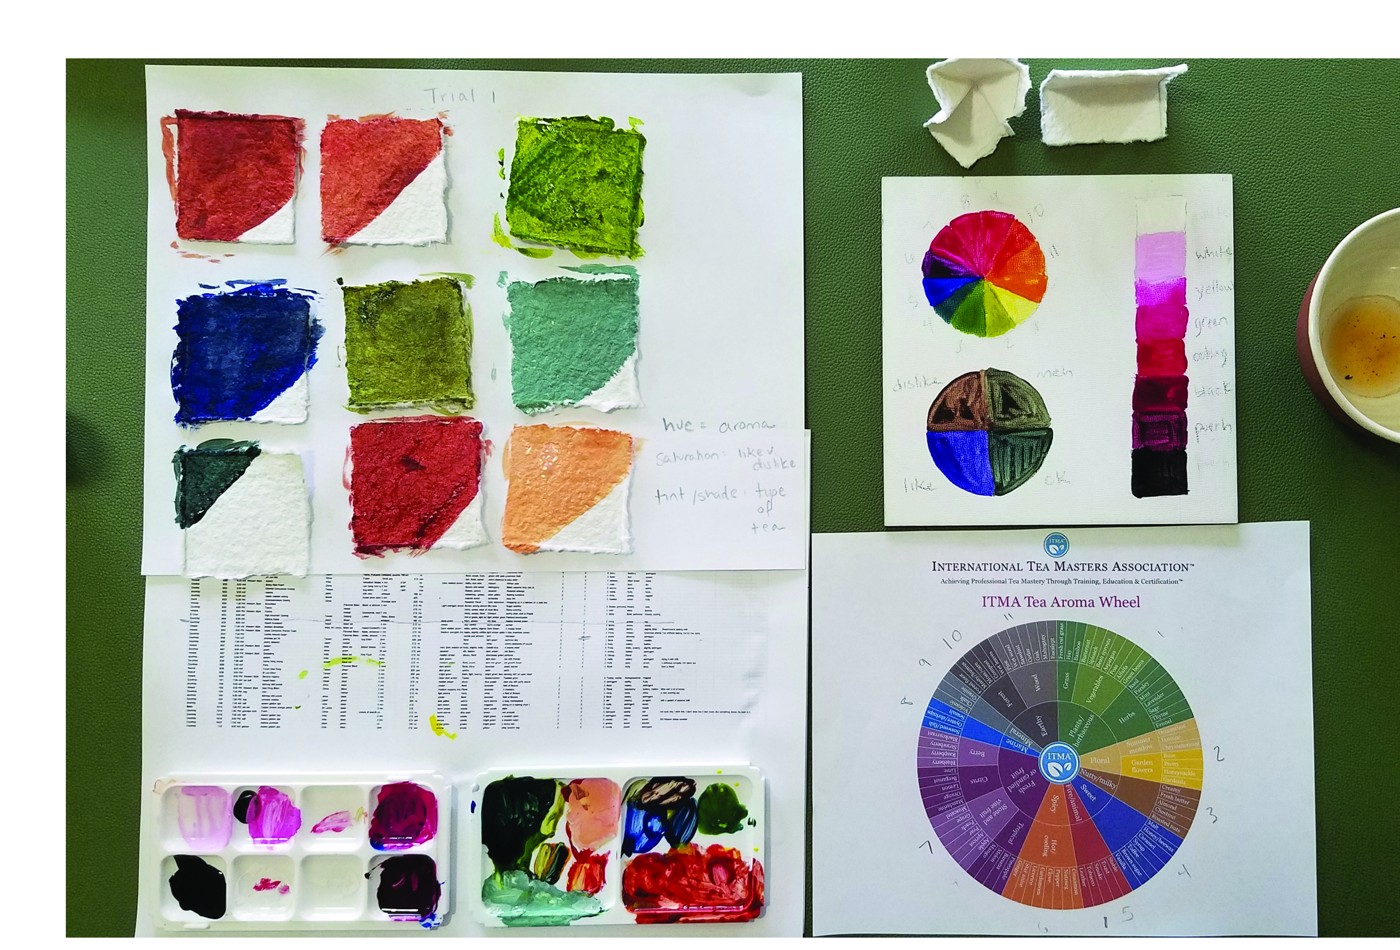
I experimented with tea stains, painted color systems, and folded paper. Hue, saturation, shade, and folds offered ways to encode aroma, tea type, and preference.
What changed: Combining several attributes made the system difficult to interpret. I needed a simpler visual language.
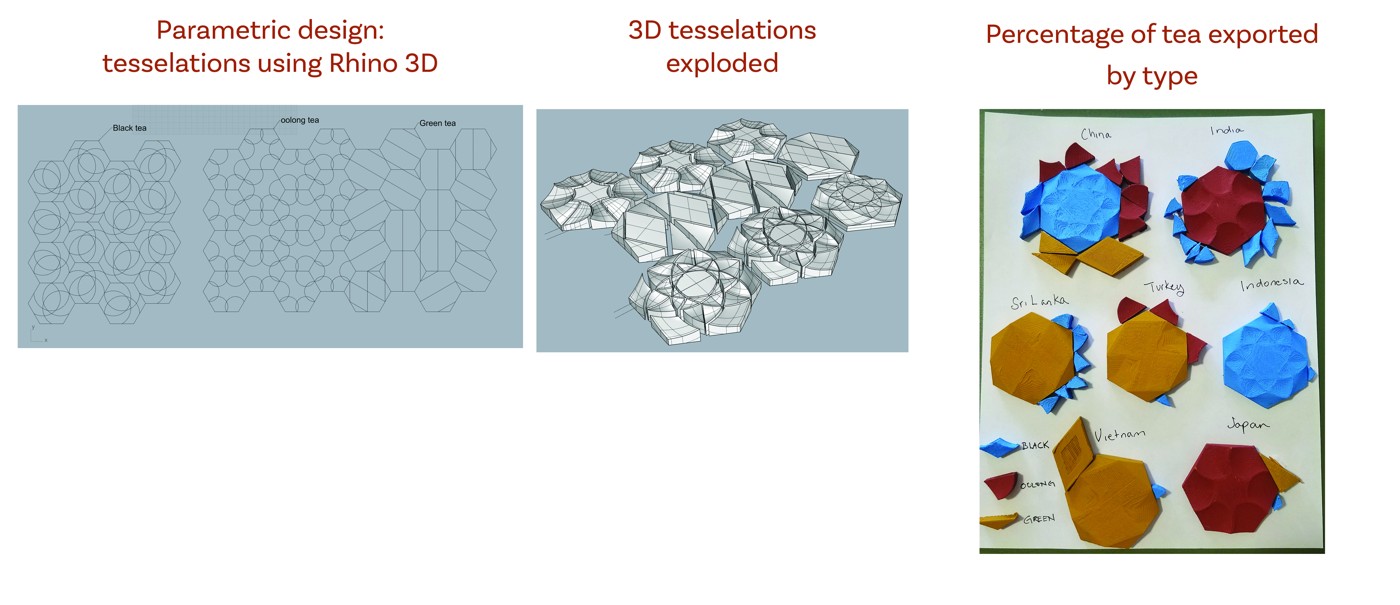
Using 3D modeling and physical prototypes, I explored production, trade, and tea types through a globe, tessellations, and modular forms.
What changed: The models opened up possibilities, but linking multiple levels of information made the relationships hard to read.
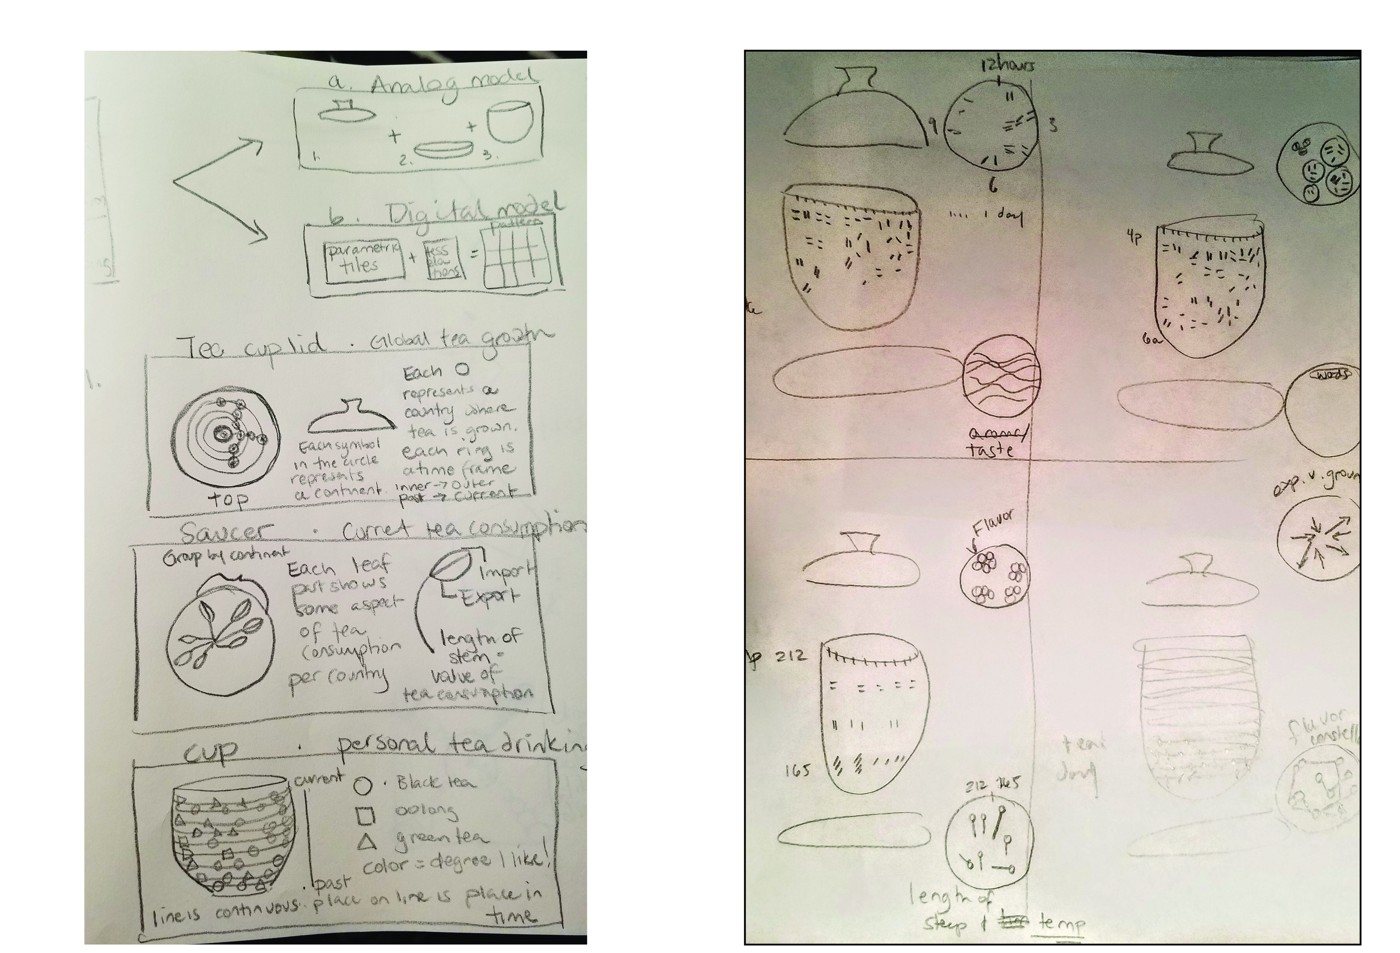
Sketching directly around tea objects gave each part of the story a place. The lid could behave like a clock; the cup could carry flavor and preference; the saucer could record brewing.
The design decision: Distribute the information across a coordinated set, with each object carrying a distinct part of the story.
A tea set offered a direct connection between the subject and the visualization. Rather than asking one form to explain everything, I could give each object a focused role and let the set bring the personal and global stories together.
From concept to material
Moving from sketches to physical objects introduced new constraints. The visual language had to work with the materials, the available space, and the marks I could make.
Carved lines, dots, and a limited set of symbols made it possible to translate the data onto curved ceramic surfaces.
Circular surfaces supported time and temperature; longer surfaces supported timelines and comparisons.
Separating the data across the set helped preserve both the personal details and their global context.
Reflection
This project brought together research, self-observation, digital prototyping, and physical making. It also taught me to revisit the central question when an idea became too complicated—and to let go of an interesting form when it did not help explain the data.
The final outcome is a set of objects that invites close looking: a way to encounter personal patterns and larger systems through the familiar ritual of making tea.