Personal data

Personal Data Stories

Personal project

A personal record of hiking Vermont’s Long Trail, visualized.

Independent projects · Personal data

Personal data stories.

A hike, a cup of tea, the sounds outside: everyday experiences offer plenty to explore through data. These projects bring that curiosity to the trail and to daily life, using both digital graphics and hand-drawn studies.

Context

Independent exploration
Hiking and everyday life

My role

Data collection, visual interpretation, illustration, and design

Approach

Personal observation, community contributions, and visual experimentation

Making observation visible.

These projects began with curiosity about experiences I knew firsthand. Recording them created opportunities to compare, notice, and ask different questions.

The design challenge was choosing a visual language that suited each subject: a structured system for comparing hikes, an illustrated overview of hikers’ experiences, and a series of drawings for the details of everyday life.

01

On the trail

Different ways to describe a hike.

Two related graphics explore hiking from different perspectives. One draws on my own records; the other brings together information I collected from fellow hikers on Reddit.

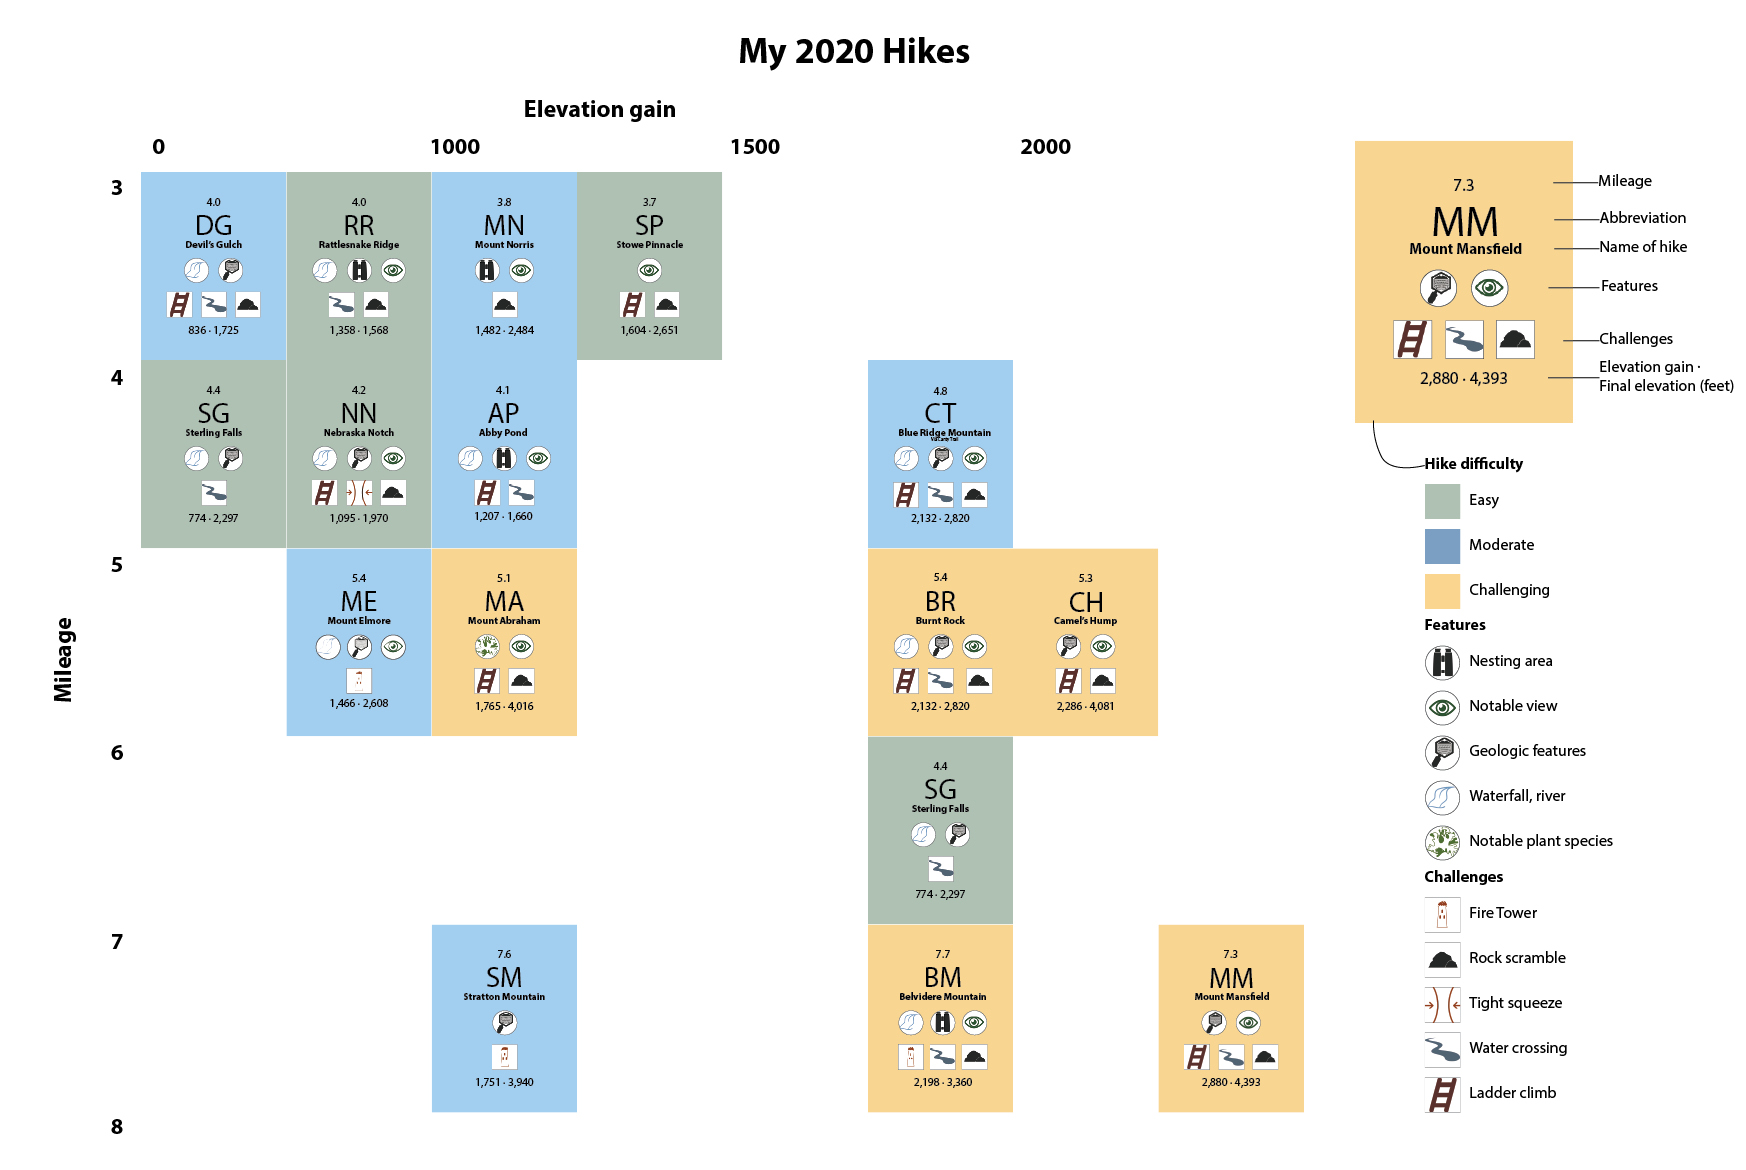
My 2020 Hikes: a periodic-table-inspired comparison of hikes by mileage, elevation gain, difficulty, features, and challenges
My 2020 Hikes. Select the graphic to explore it at a larger size.

Data source · My own hiking records

A periodic table of hikes.

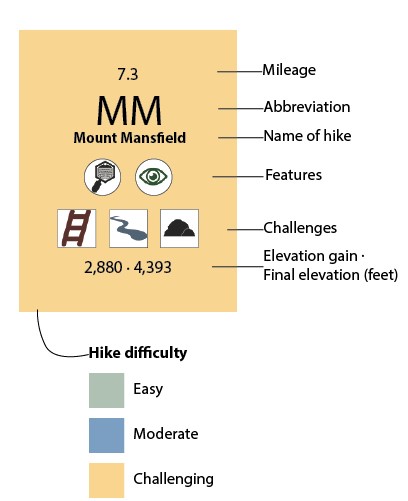
I organized my hiking data into a system of individual tiles. Their positions compare mileage and elevation gain, while color and symbols add information about difficulty, features, and challenges.

The repeating format makes the hikes comparable without losing the details that distinguish one outing from another.

Design decision

Use a consistent tile for each hike, with several layers of information that readers can explore through the key.

Explore the tile and symbol keyAnnotated Mount Mansfield hike tile explaining mileage, abbreviation, features, challenges, elevation, and difficultyLegend for hike difficulty, natural features, and trail challenges

Color communicates difficulty; symbols identify features and challenges.
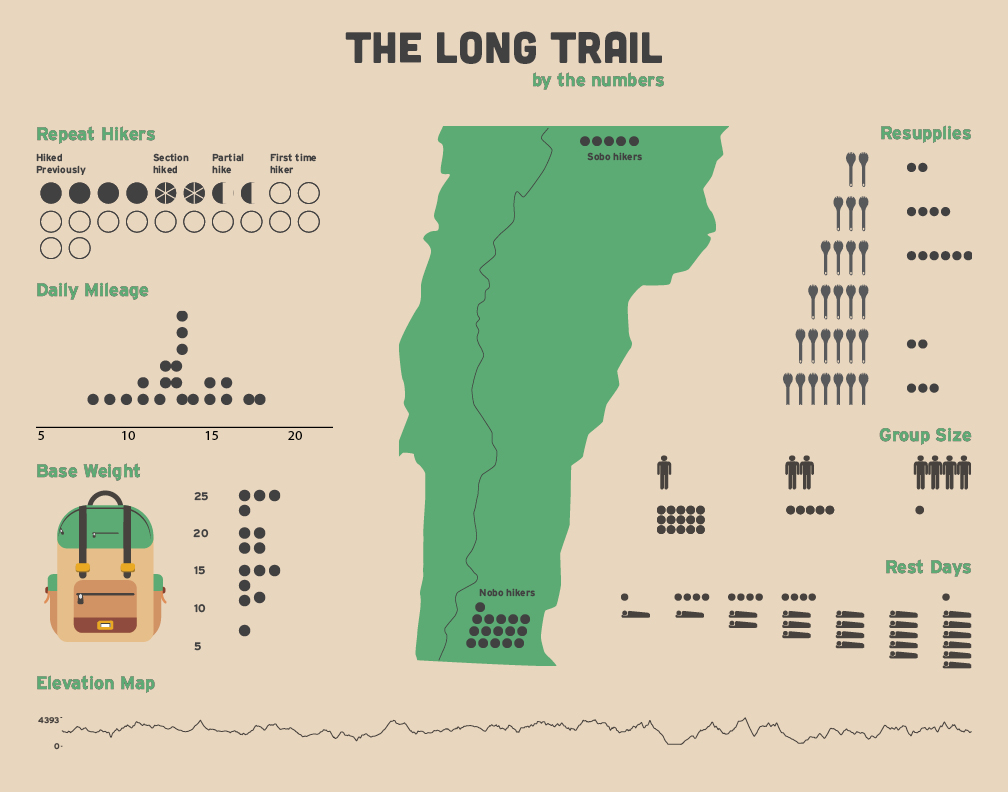
The Long Trail by the numbers: Vermont trail map surrounded by graphics about hikers, mileage, pack weight, resupplies, group size, and rest days
The Long Trail by the numbers: experiences collected from other hikers.

Data source · Hikers on Reddit

A trail seen through its hikers.

For the Long Trail infographic, I collected data from other hikers on Reddit. The graphic brings together details such as daily mileage, pack weight, resupplies, group size, and rest days.

A map provides the geographic focus, while small charts and repeated icons organize the different parts of the experience around it.

Design decision

Combine a recognizable place with several focused comparisons, creating an overview of the contributed experiences.

These contributions describe participating hikers; they are not presented as a representative survey of everyone who hikes the Long Trail.

02

Dear Data

Everyday life, drawn as data.

Dear Data was an independent practice: a chance to enjoy looking at ordinary experiences through the lens of data. Each hand-drawn study gave a different subject its own visual language.

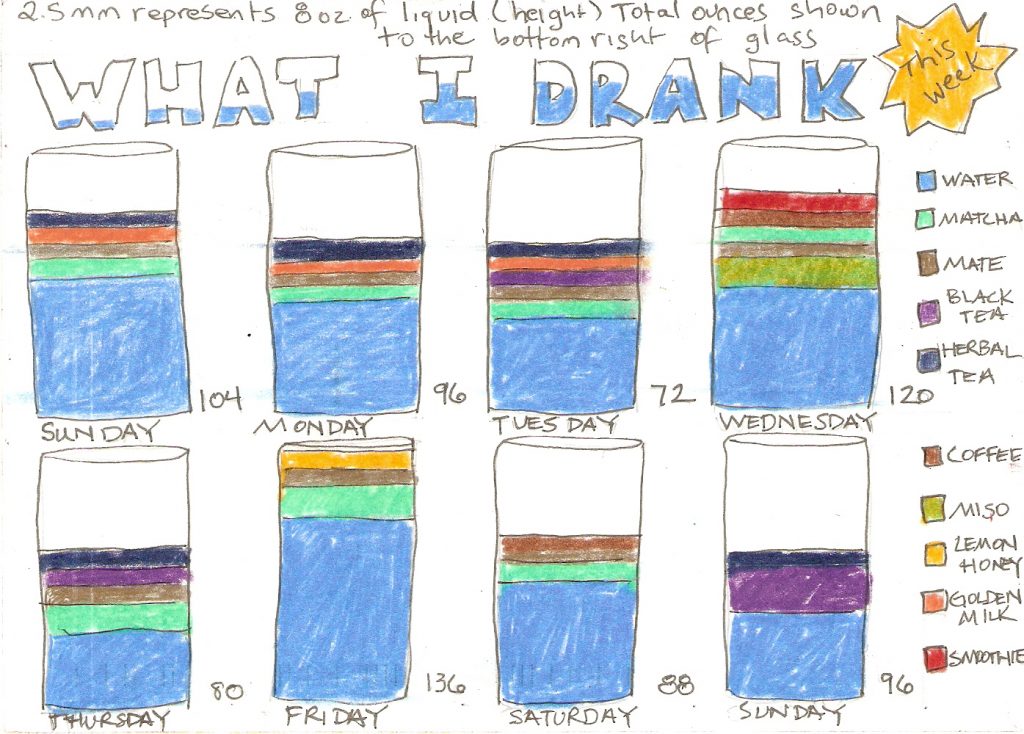
What I drank — hand-drawn personal data study

What I drank

Stacked colors inside drawn glasses turn daily drinks into a record of quantity and variety. The familiar container helps connect the marks to the experience.

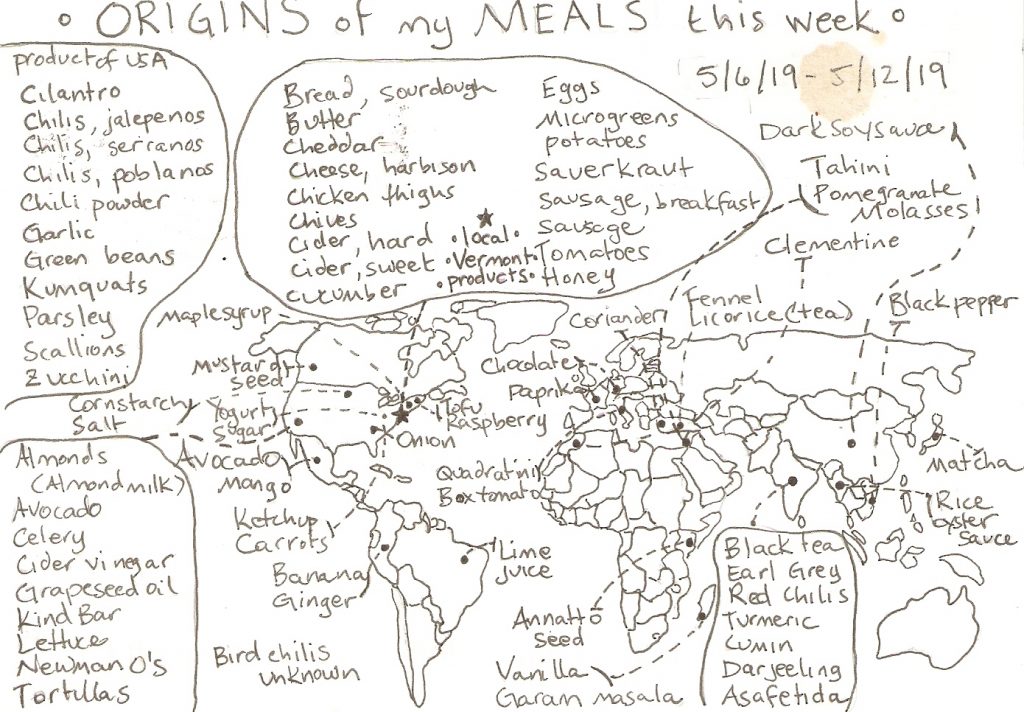
Where my meals began — hand-drawn personal data study

Where my meals began

Ingredient notes and a world map trace the origins recorded for a week of meals, connecting everyday eating to places farther away.

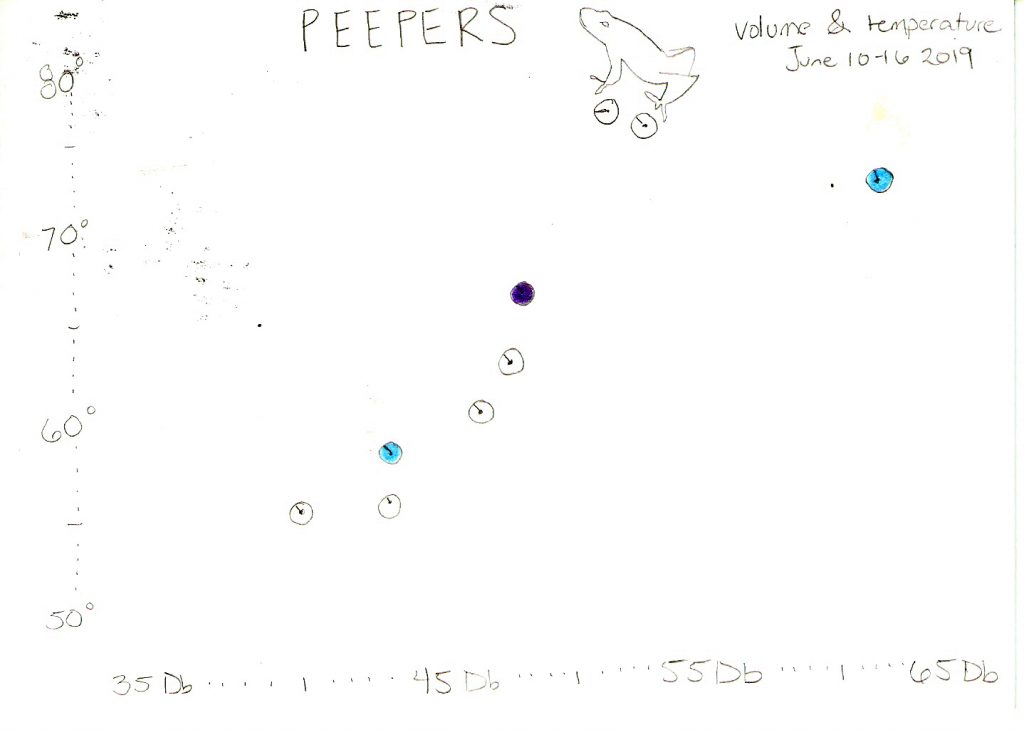
Listening to peepers — hand-drawn personal data study

Listening to peepers

A study of sound and temperature brings an outdoor observation into the collection. Color and marks give the recorded moments a visual form.

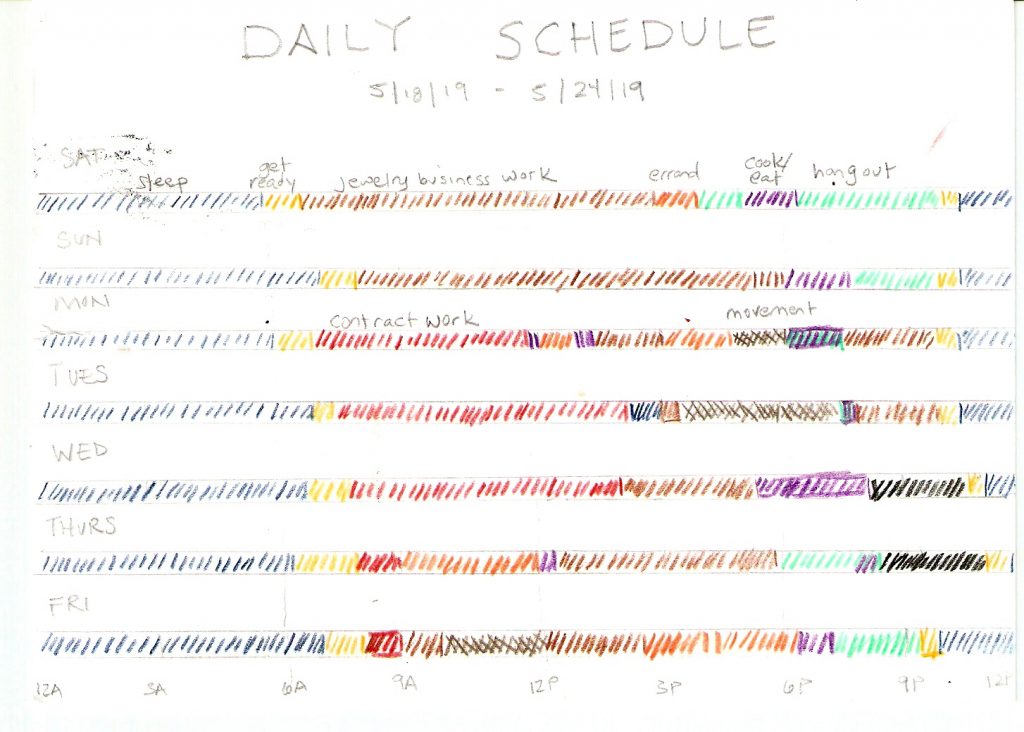
The shape of a day — hand-drawn personal data study

The shape of a day

Rows of small, colored marks follow the daily schedule, showing how an ordinary week can become a pattern of time and activity.

Choose something ordinary

Start with a subject close at hand: drinks, meals, daily activities, or the sounds outside.

Give it a visual language

Use color, symbols, position, and repetition to turn recorded observations into a readable drawing.

Make room for curiosity

The enjoyment lies in looking again—seeing an everyday experience as something that can be recorded and explored.

A continuing practice

Small observations. Many ways to tell a story.

Together, these projects show my interest in finding visual forms for lived experience. Some subjects benefit from a structured comparison; others invite a more informal, hand-drawn approach. The shared starting point is curiosity about the details of daily life.

Next project Joint Fiscal Office →