Separate the measures
Give dollars and percentages distinct scales instead of asking readers to decode a dual-axis chart.
Selected project · Vermont Joint Fiscal Office
Turning dense charts and report materials into visual explanations that help readers find the comparison, follow the story, and understand what matters.
Explore two examplesThe challenge
Fiscal reports bring together dollar amounts, percentages, trends, and policy details. When those elements compete for attention, readers have to work harder to understand the point. My work focused on clarifying those relationships and developing consistent design conventions that could carry across JFO’s reports.
Before & after · Income tax
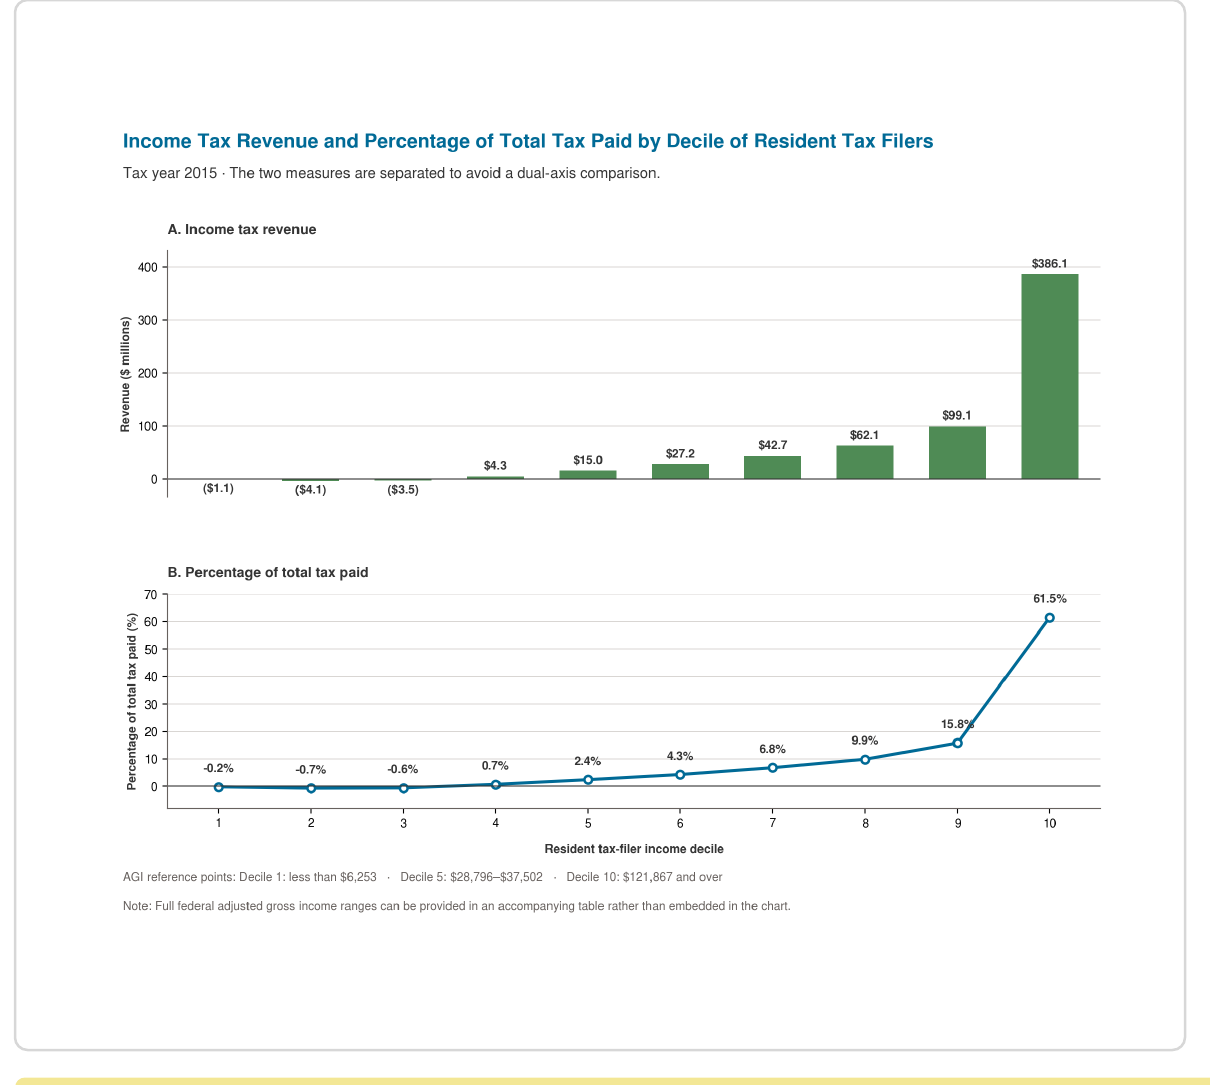
The original chart combined tax revenue and the percentage of total tax paid on two different scales. I separated the measures into aligned panels, keeping the same decile order so readers could follow the relationship between them.
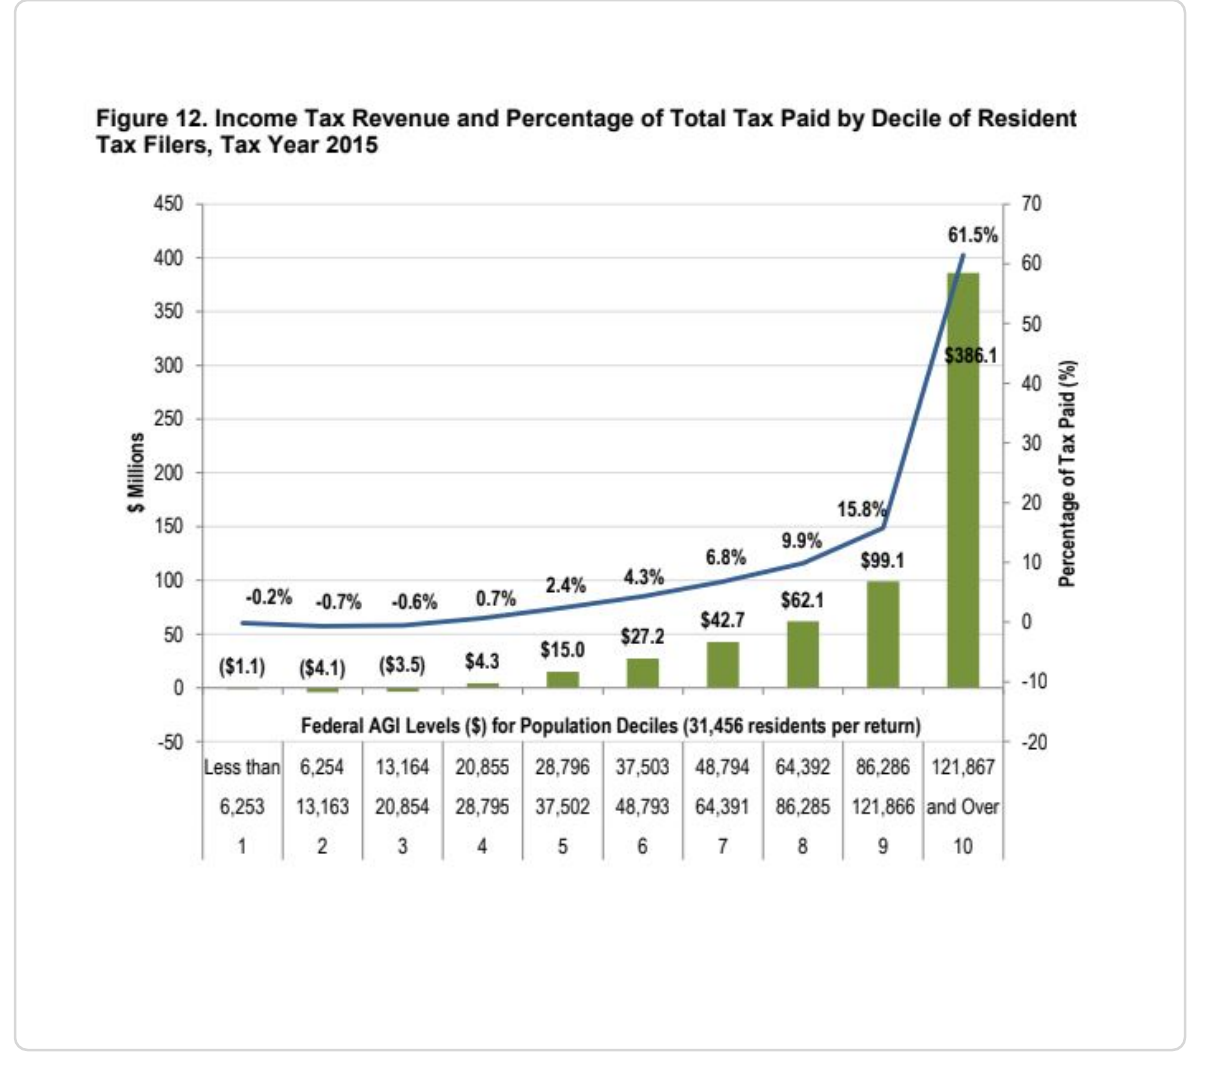
Dollar amounts, percentages, and income ranges compete within the same view.
Each measure has its own scale and space, with consistent ordering connecting the two.
Select either chart to enlarge
Give dollars and percentages distinct scales instead of asking readers to decode a dual-axis chart.
Keep categories in the same order so the two views remain easy to compare.
Move supporting income-range information out of the plotting area.
Benefits cliffs · Figure 3
Higher earnings do not always mean more resources available to a household. This chart shows the change in total resources for each $1,000 increase in earnings, making the losses stand out against the gains.
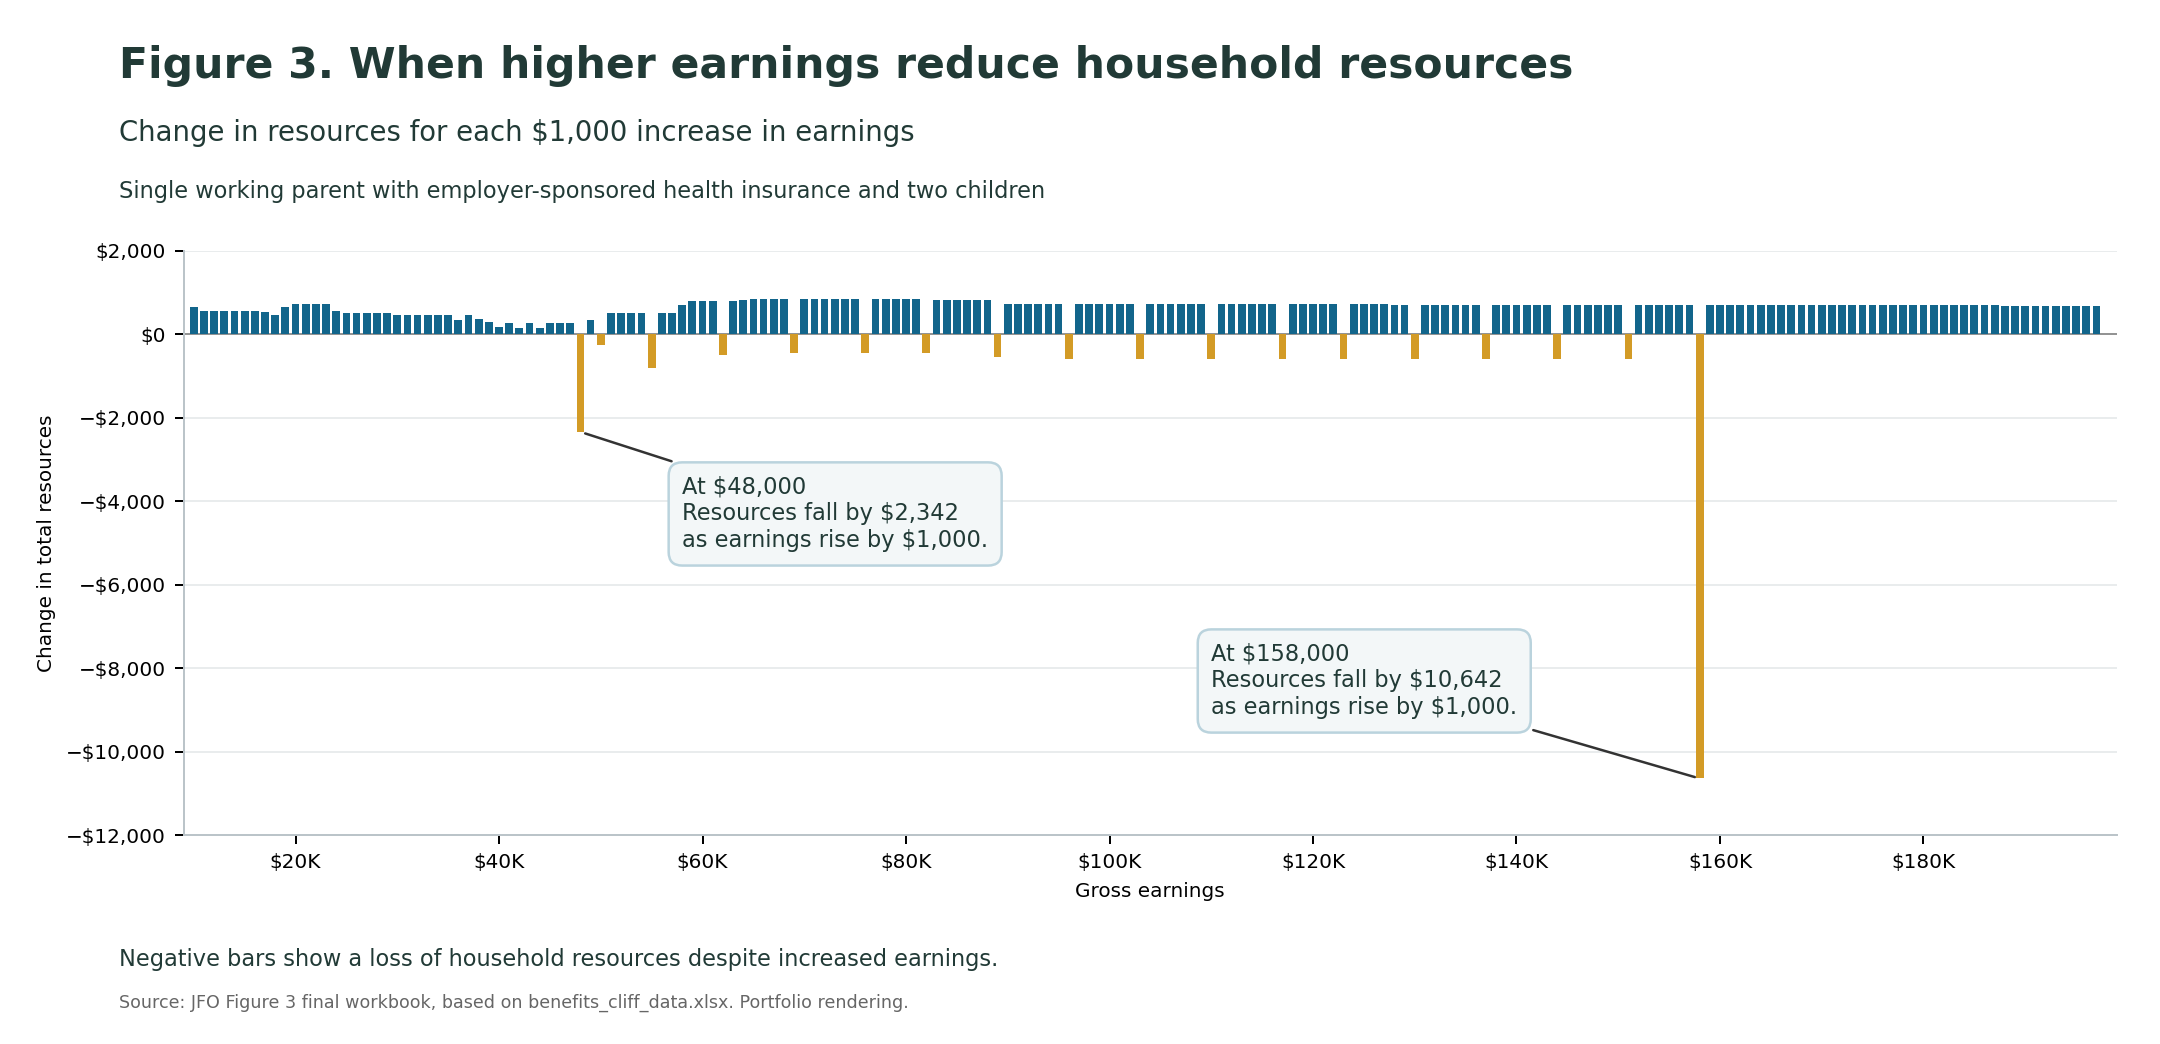
Single working parent with employer-sponsored health insurance and two children. Portfolio rendering from the final Figure 3 workbook.
Use color to distinguish gains from losses, then place explanations beside the two largest drops so readers can connect the numbers to the pattern.
Beyond individual charts
The engagement extended beyond these examples. I translated design decisions into shared guidance and editable materials that JFO could use as information changes.
Consistent approaches to color, typography, labels, spacing, and hierarchy.
Excel charts that allow staff to update data within an established visual structure.
Word layouts that bring narrative, charts, and supporting information together.
The outcome
The project produced redesigned visualizations, shared style guidance, and reusable report components—a practical foundation for presenting complex fiscal information more clearly.