Lead with the implications
Headlines connect the findings to affordability, student progress, and opportunity.
Visualizing scenarios and treatment comparisons for a statewide mathematics reform research initiative.


Selected project · Maryland Mathematics Reform Initiative
Helping university leadership communicate how mathematics reform could lower student costs and open more paths to graduation and career opportunities.
The challenge
The Maryland Mathematics Reform Initiative explored new mathematics pathways that could help students progress through college, save money, and access broader opportunities. Communicating the value of that reform meant connecting research findings to consequences people could readily understand.
Beginning with conversations with University of Maryland leadership, I developed the visual approach, graphics, and report design through Inciter. The materials were created primarily for leadership to present to policymakers, alongside graphics intended to build public understanding and support.
Policymaker communication
A single infographic brings together student costs, course completion, and progression into credit-bearing mathematics. Clear takeaways and coordinated comparisons help readers navigate the case for reform.
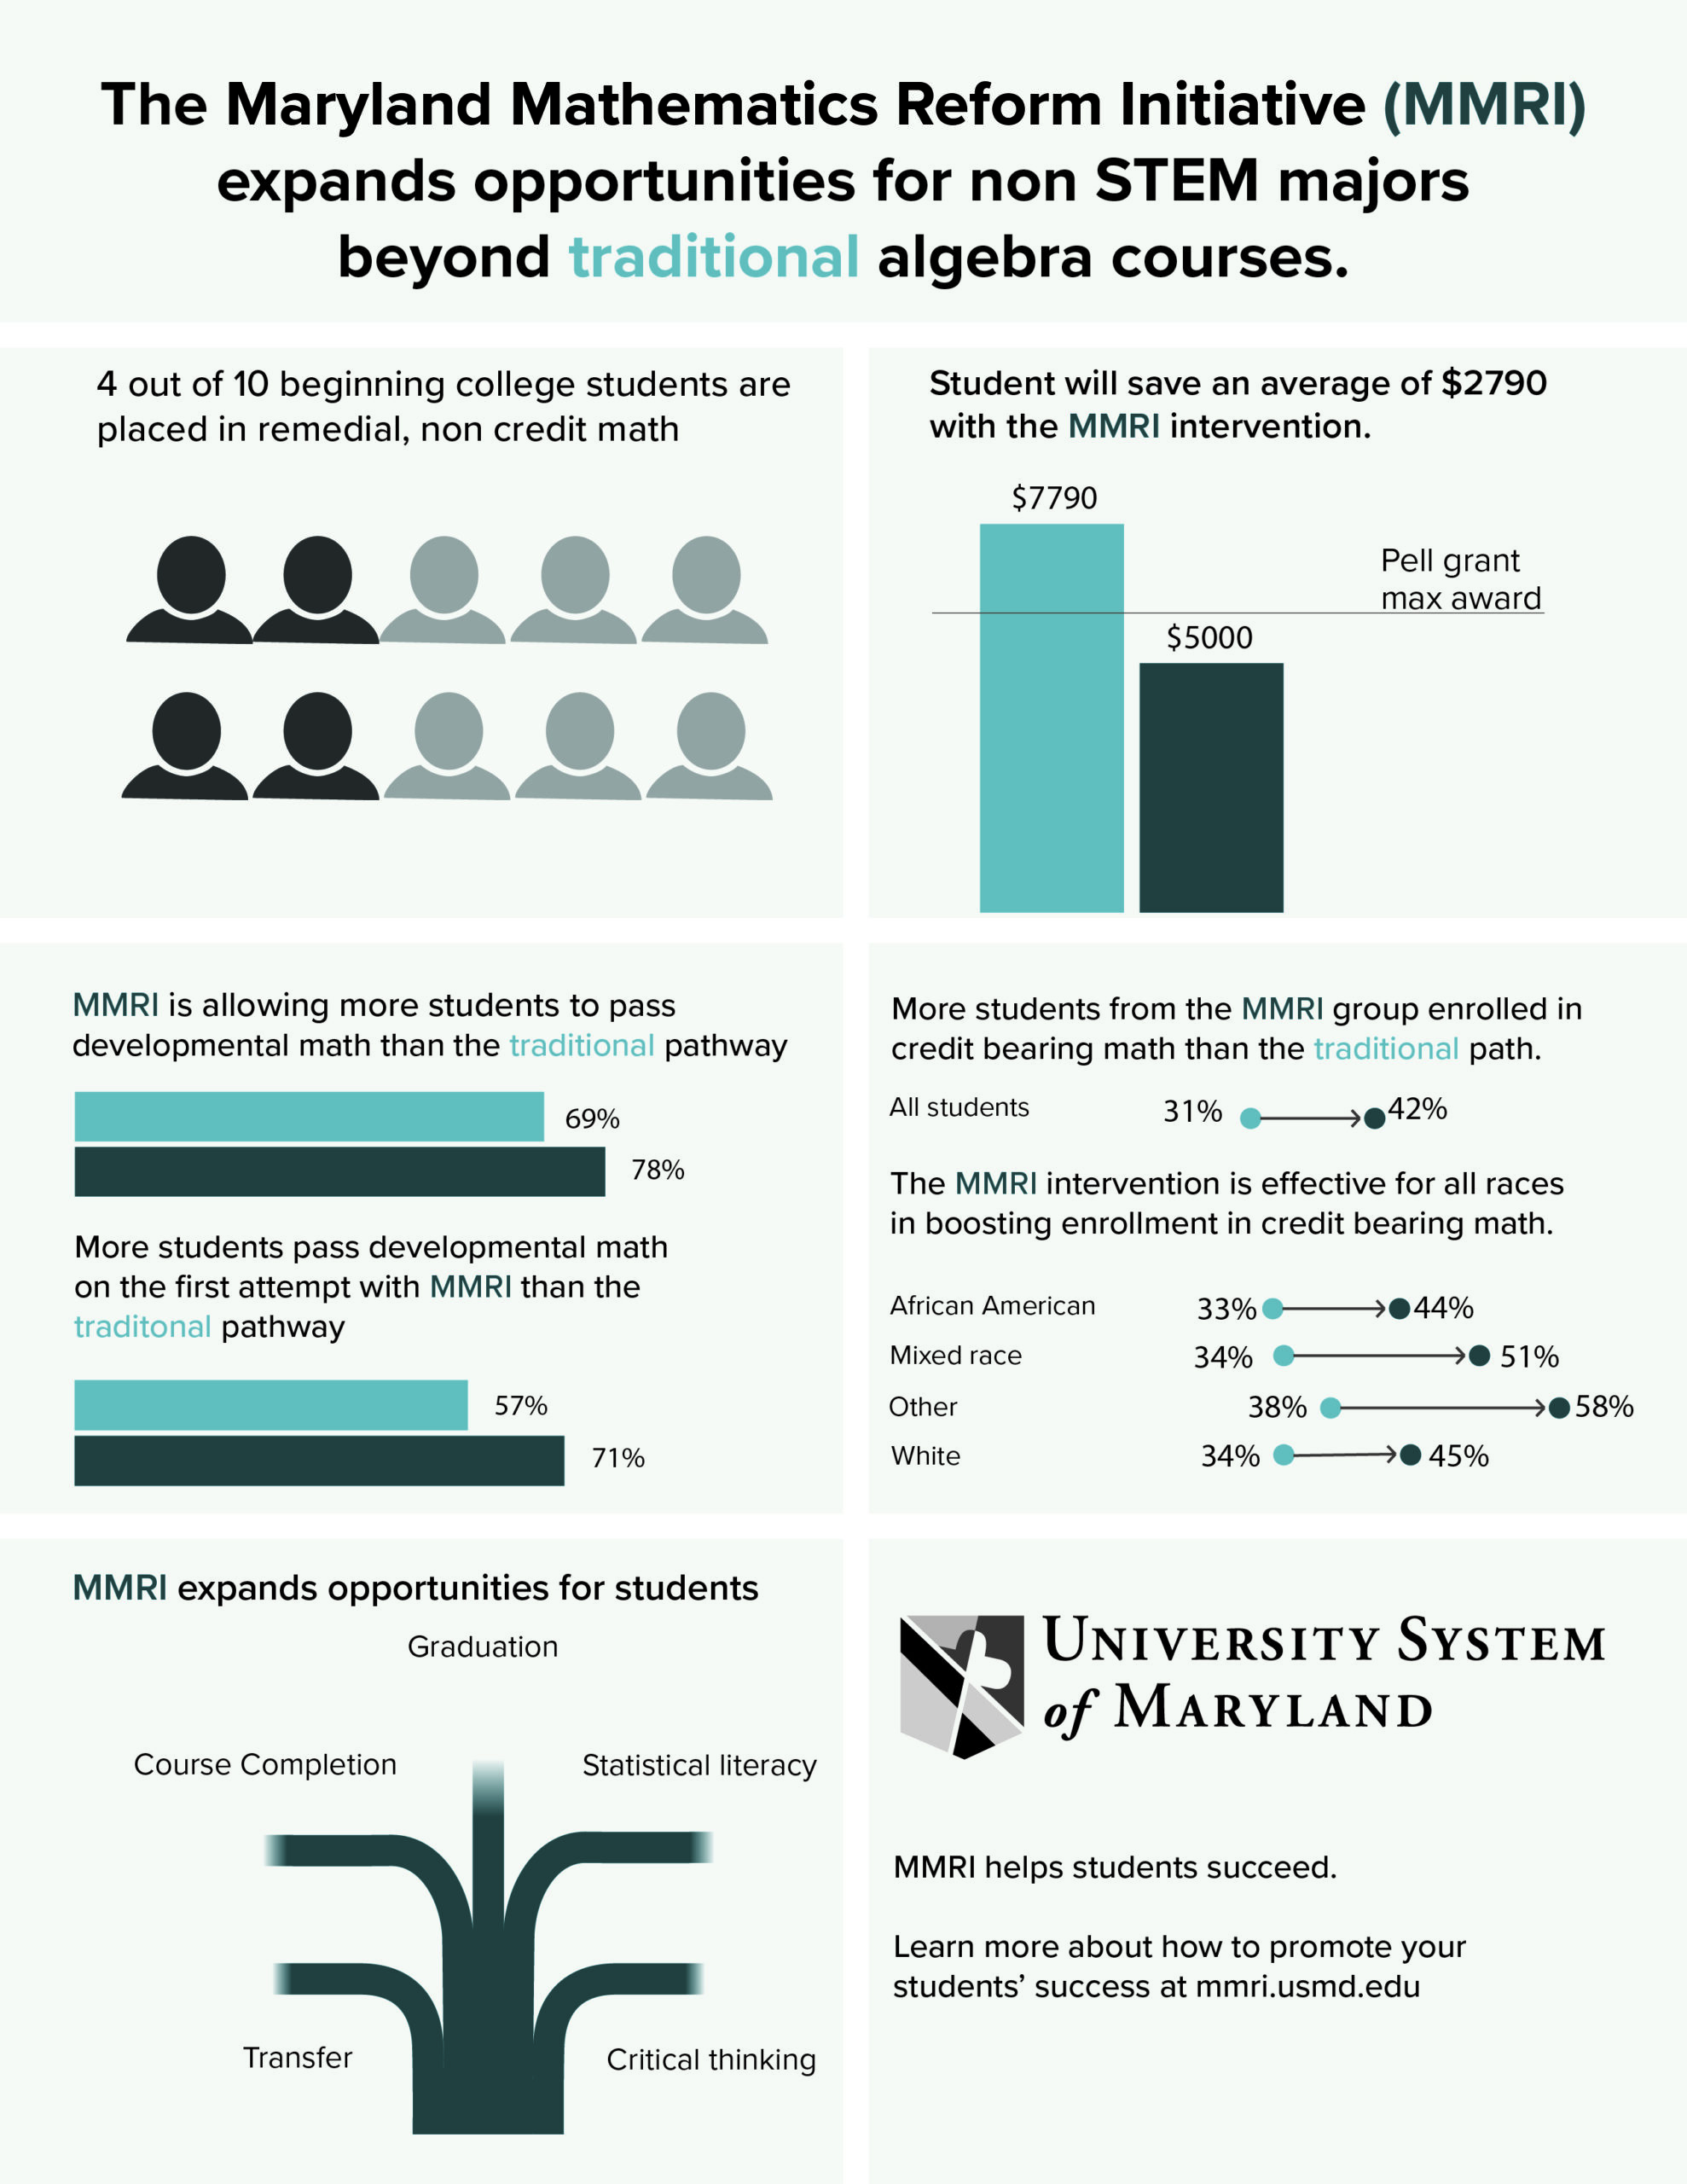
Original project infographic. Figures and funding references reflect the project period. Select to enlarge.
Headlines connect the findings to affordability, student progress, and opportunity.
A shared teal palette links the traditional and MMRI pathways across different measures.
Distinct panels let readers scan the main messages and then explore the supporting numbers.
Student pathways · Scenario comparison
Semester-by-semester scenarios show how repeated attempts, successful completion, and interruptions can shape a student’s path. A common visual structure makes the treatment and comparison scenarios easier to follow.
Illustrative scenarios explaining student progression, rather than individual student records. Select to enlarge.
The process
Conversations with university leadership established the starting point for the design work: what the initiative needed to communicate and who needed to understand it.
Identify the reform’s central ideas and their relevance to policymakers and the public.
Translate the material into comparisons, student scenarios, and accessible visual concepts.
Carry the visual approach through graphics and report layout for leadership’s communication needs.
Concept development
An exploratory road illustration uses routes, exits, and U-turns to make barriers to student progress tangible. It explores how a more direct mathematics pathway might be explained to a broad audience.
Shown as part of the design process; the original draft includes placeholder copy. Select to enlarge.
The deliverables
The project brought together data graphics, student-pathway explanations, and report design to support leadership presentations to policymakers and communication with the public. It shows my approach to turning a complex initiative into a visual story grounded in its relevance to people’s lives.
Maryland Mathematics Reform Initiative · University of Maryland · Completed through Inciter.