Ground the explanation in place
A recognizable local landscape makes an abstract environmental issue tangible.
An interactive story map and dashboard presenting the Neighborhood Design Center’s stormwater work.
Selected project · Stormwater StoryMap & Dashboard
An interactive story connecting flooding in Annapolis, the surfaces that shape runoff, and the Neighborhood Design Center’s work to reduce the impact of heavy rain.
The challenge
Following severe flooding, the Neighborhood Design Center was addressing ways to mitigate the impact of heavy rains. The project needed to connect a visible problem—flooding—with the less visible relationships between the built environment, runoff, and landscape design.
Created at MICA in partnership with NDC, this StoryMap combines geographic context, visual explanation, and project data. I created all of the work shown, bringing the material into a narrative that moves from the problem to practical responses.
Storytelling through maps
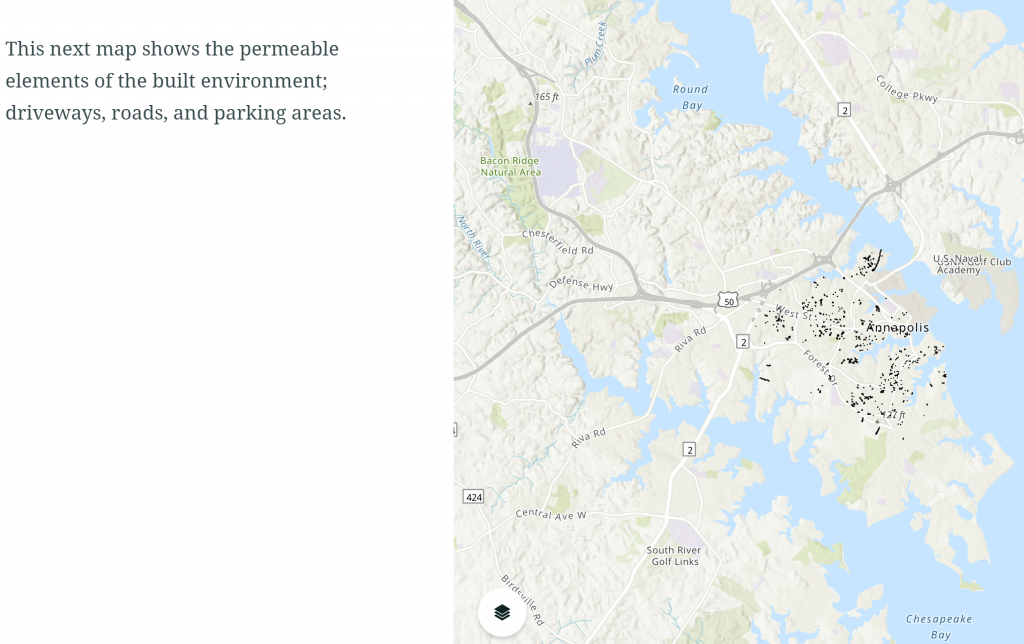
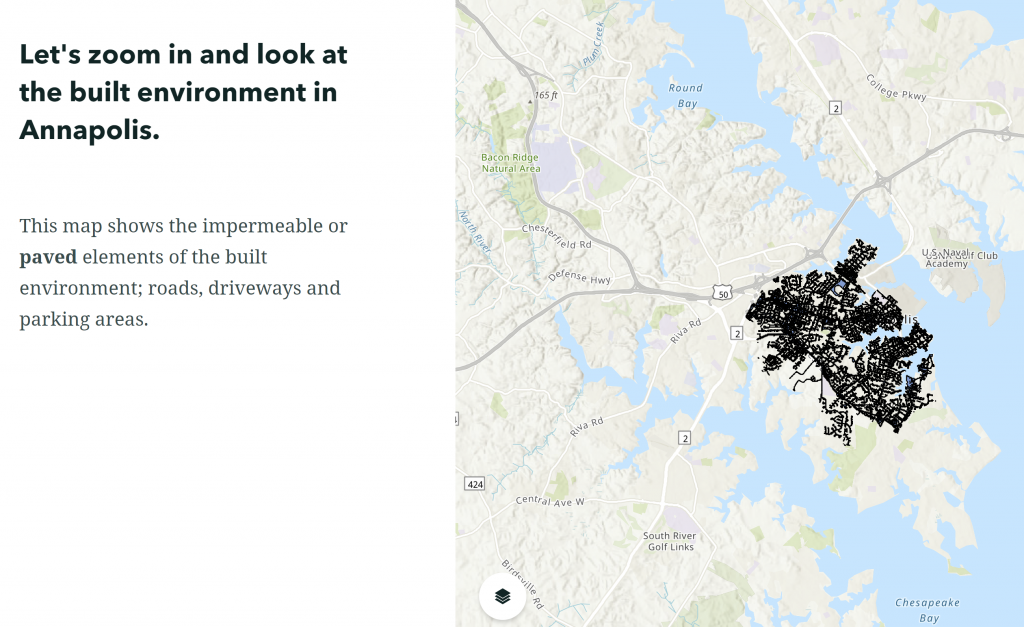
The StoryMap focuses on Annapolis, pairing short explanations with maps of paved and unpaved surfaces. Moving between these views gives readers a concrete way to explore the built environment and its relationship to stormwater.
Screenshots from the original project. Select either image to enlarge.
A recognizable local landscape makes an abstract environmental issue tangible.
Short narrative passages guide readers through successive map views.
The story progresses toward trees, rain gardens, and other landscape approaches to managing stormwater.
The narrative
The sequence links the local context to the role of surface materials and planting, then introduces NDC’s work.
Begin with flooding in Annapolis and the need to reduce the impact of heavy rain.
Use maps and images to connect paved surfaces, runoff, and opportunities for absorption.
Introduce approaches such as tree planting, reforestation, rain gardens, and stormwater plantings.
Project dashboard
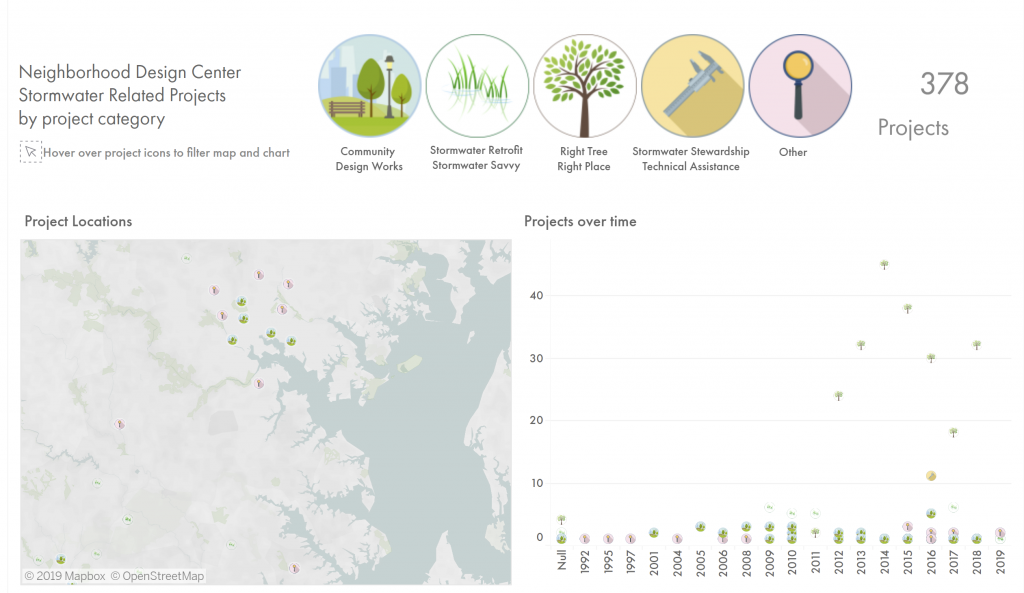
The dashboard brings NDC’s stormwater-related projects together by category, location, and time. Shared illustrated category symbols connect the map and timeline, and the interactive Tableau dashboard lets readers explore those views by project type.
Explore the dashboard full-screen ↗
Use the dashboard’s category icons to explore the projects. If the embed does not load or feels cramped on your device, open the full-screen version.
The map and timeline offer complementary ways to explore the project collection.
Consistent category icons help readers follow project types across the display.
Category filtering gives readers a way to focus on a particular area of NDC’s work.
The finished project
The StoryMap and dashboard bring environmental context and organizational project data into one experience. Together, they show how I use narrative, maps, and visual consistency to help readers understand a complex topic and explore it for themselves.
View the interactive StoryMap ↗
MICA academic project · Created in partnership with the Neighborhood Design Center · 2019.