Align different kinds of information
A common timeline allows readers to connect changes across subject matter, visual style, and historical events.
Single-image stories on public topics — incarceration, gun policy, safe sleep, hospital expansion and more.


Selected work · Static storytelling
Two MICA projects exploring how research, visual structure, and editorial choices can turn complex material into a story on a single page.
The common challenge
These projects began with different kinds of material: independently researched data about incarceration, and an assignment to communicate Globe’s history after MICA acquired its poster archive.
In each piece, the design challenge was to select, organize, and connect information so that readers could follow a larger story while still exploring individual details.
Imprisoned · Independent data research
For an open-ended data-storytelling assignment, I followed my interest in incarceration and recidivism. I researched the topic and developed a long-form infographic that moves from the scale of imprisonment to population comparisons, spending, and education.
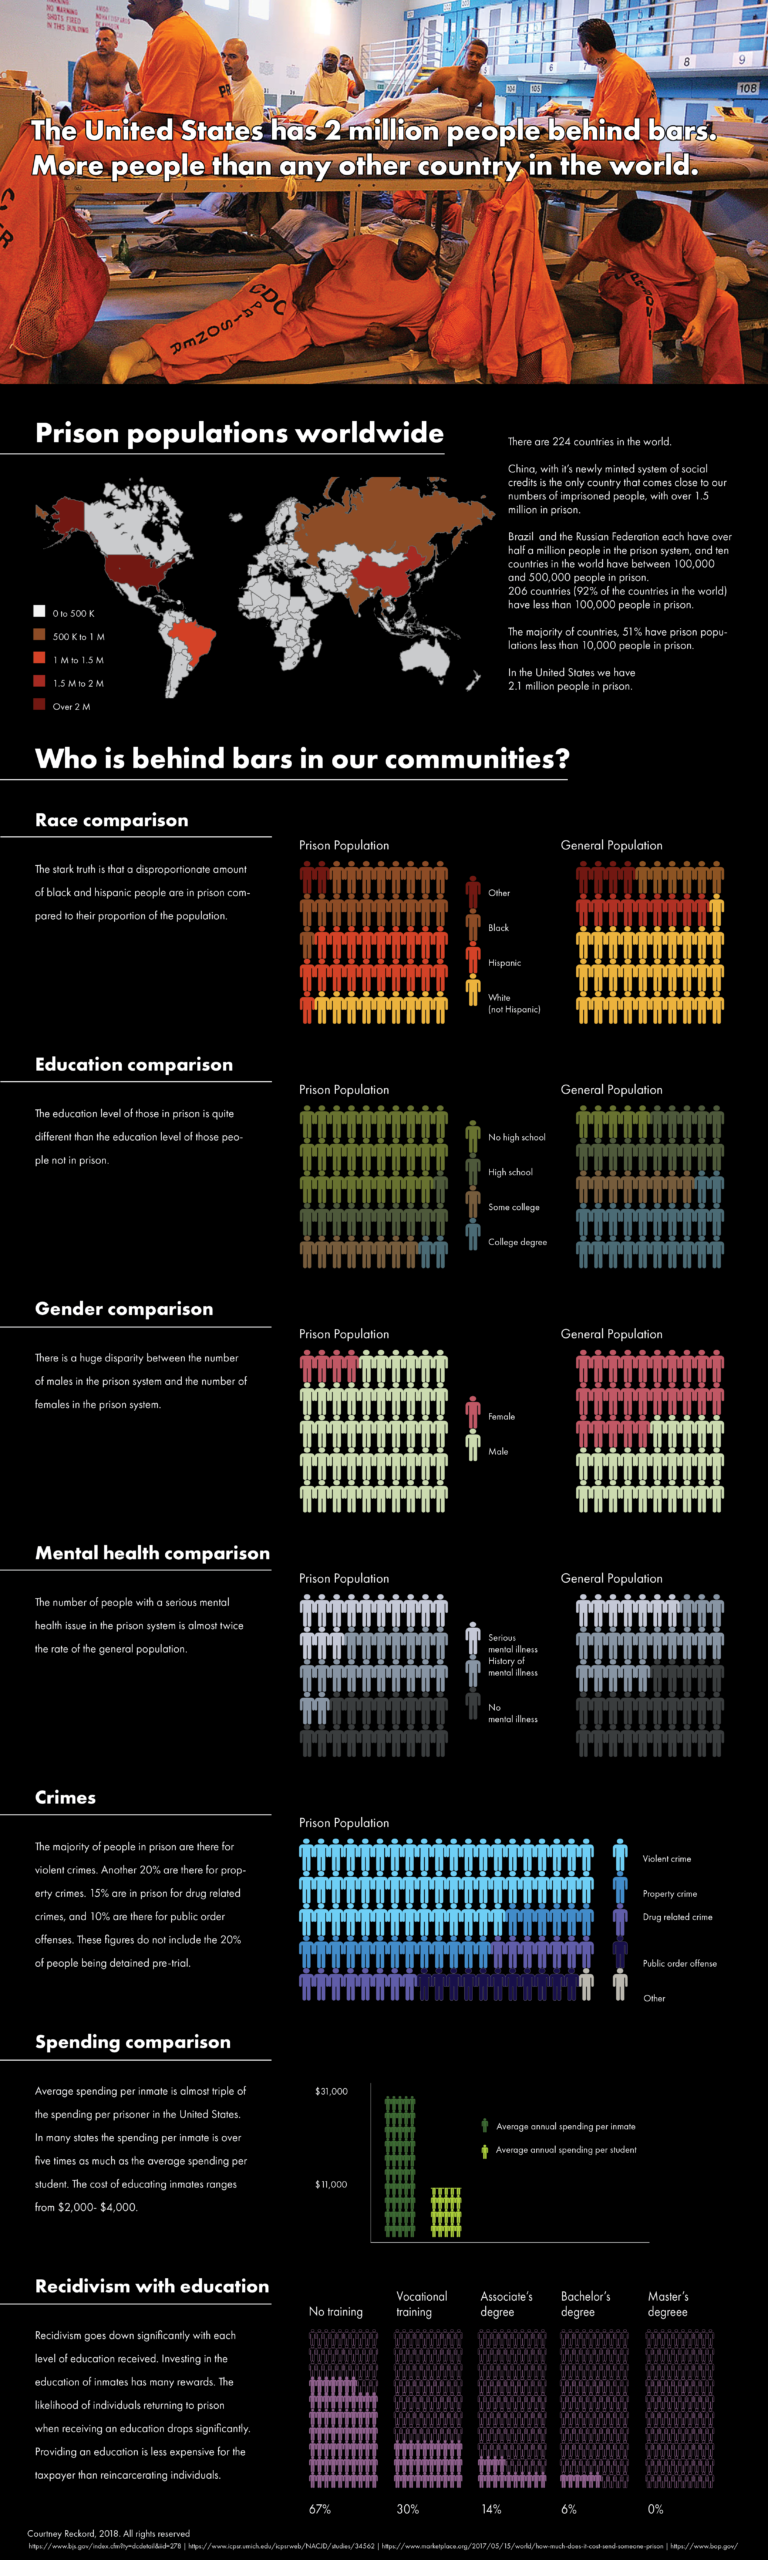
The sequence begins with a worldwide view and gradually narrows toward education and recidivism.
Repeated person symbols and paired population displays connect the sections visually, while color distinguishes the categories within each comparison.
Headings, short explanatory passages, and a vertical reading order guide readers through a substantial amount of information.
Original academic work, shown in full. Figures and source references reflect the research conducted for the project.
Eighty One Years of Globe · Archive-based storytelling
After MICA acquired Globe’s poster archive, the assignment was to create a piece that showed the history of Globe. I organized the story along a shared timeline, bringing poster subjects, geographic reach, visual styles, and historical context into one composition.
A common timeline allows readers to connect changes across subject matter, visual style, and historical events.
Poster imagery, distinctive lettering, and color samples bring the visual identity of Globe into the explanation.
Readers can follow a category across decades or look down a period to explore what was changing at the same time.
The collection
One project grew from a personal research interest; the other responded to a newly acquired archive. Both show how I use structure, visual comparison, and narrative sequence to help readers navigate complex material.
Selected MICA academic work · Courtney Reckord.