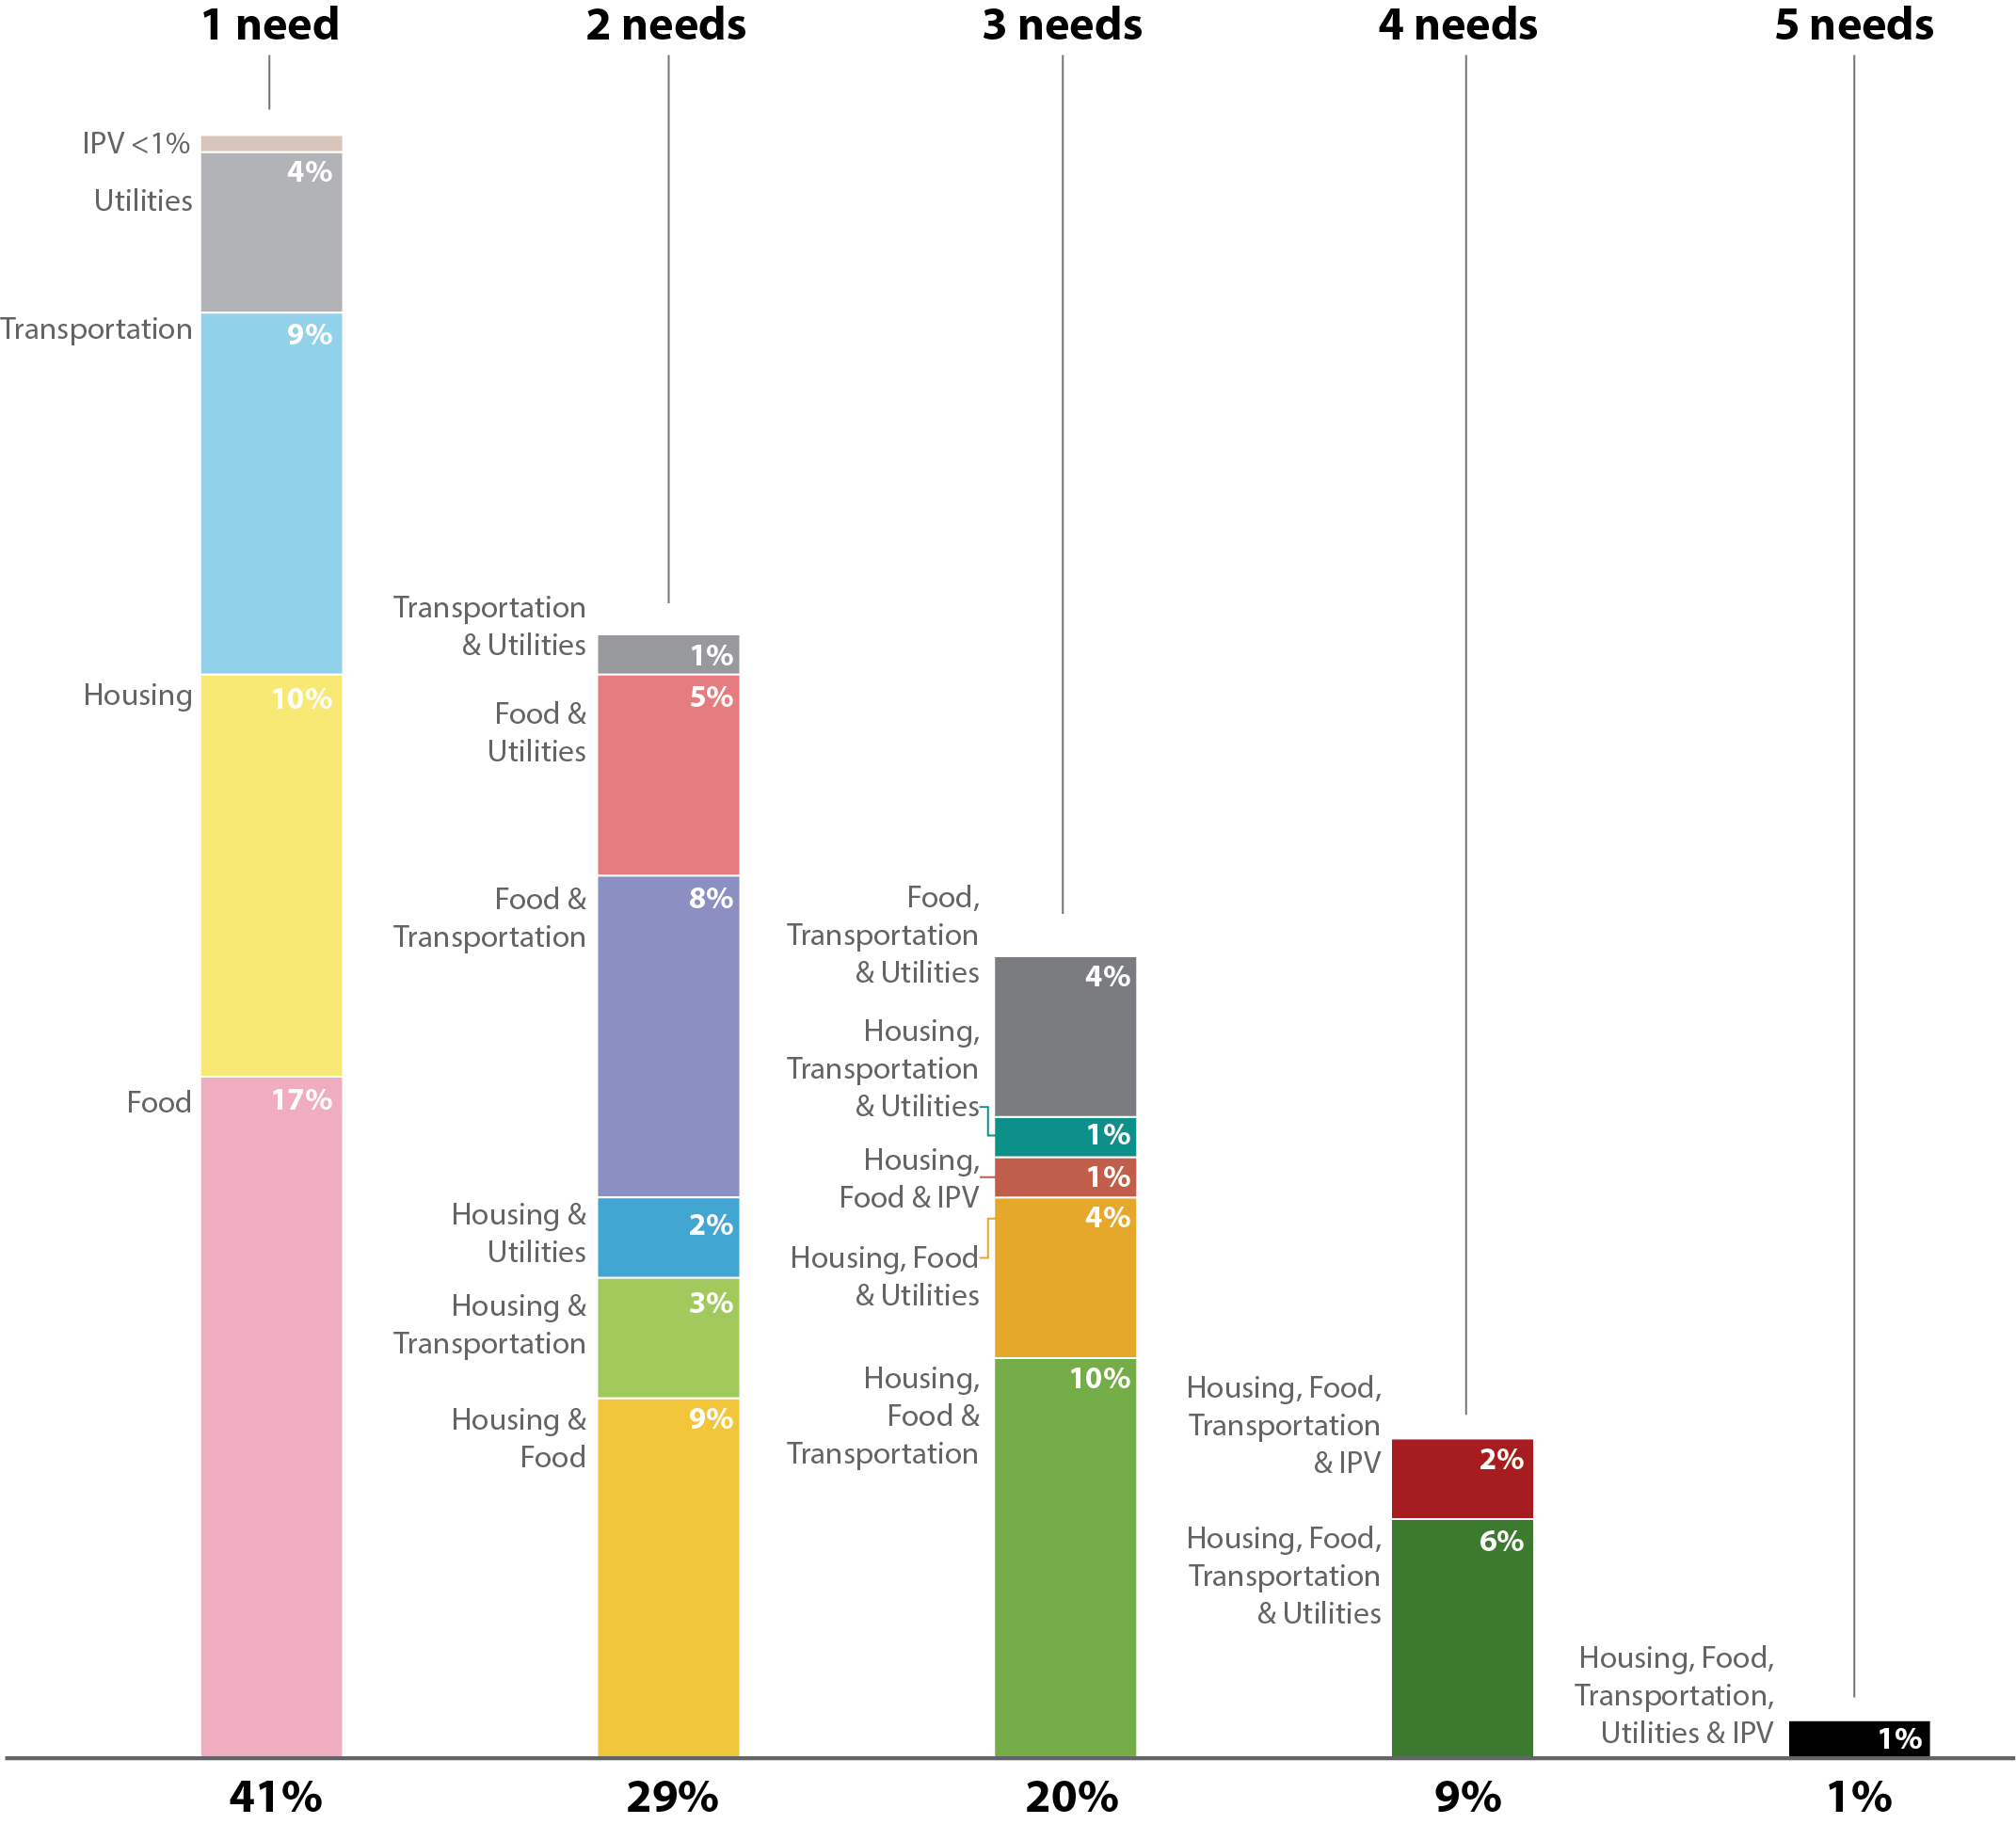
Keep the scale consistent
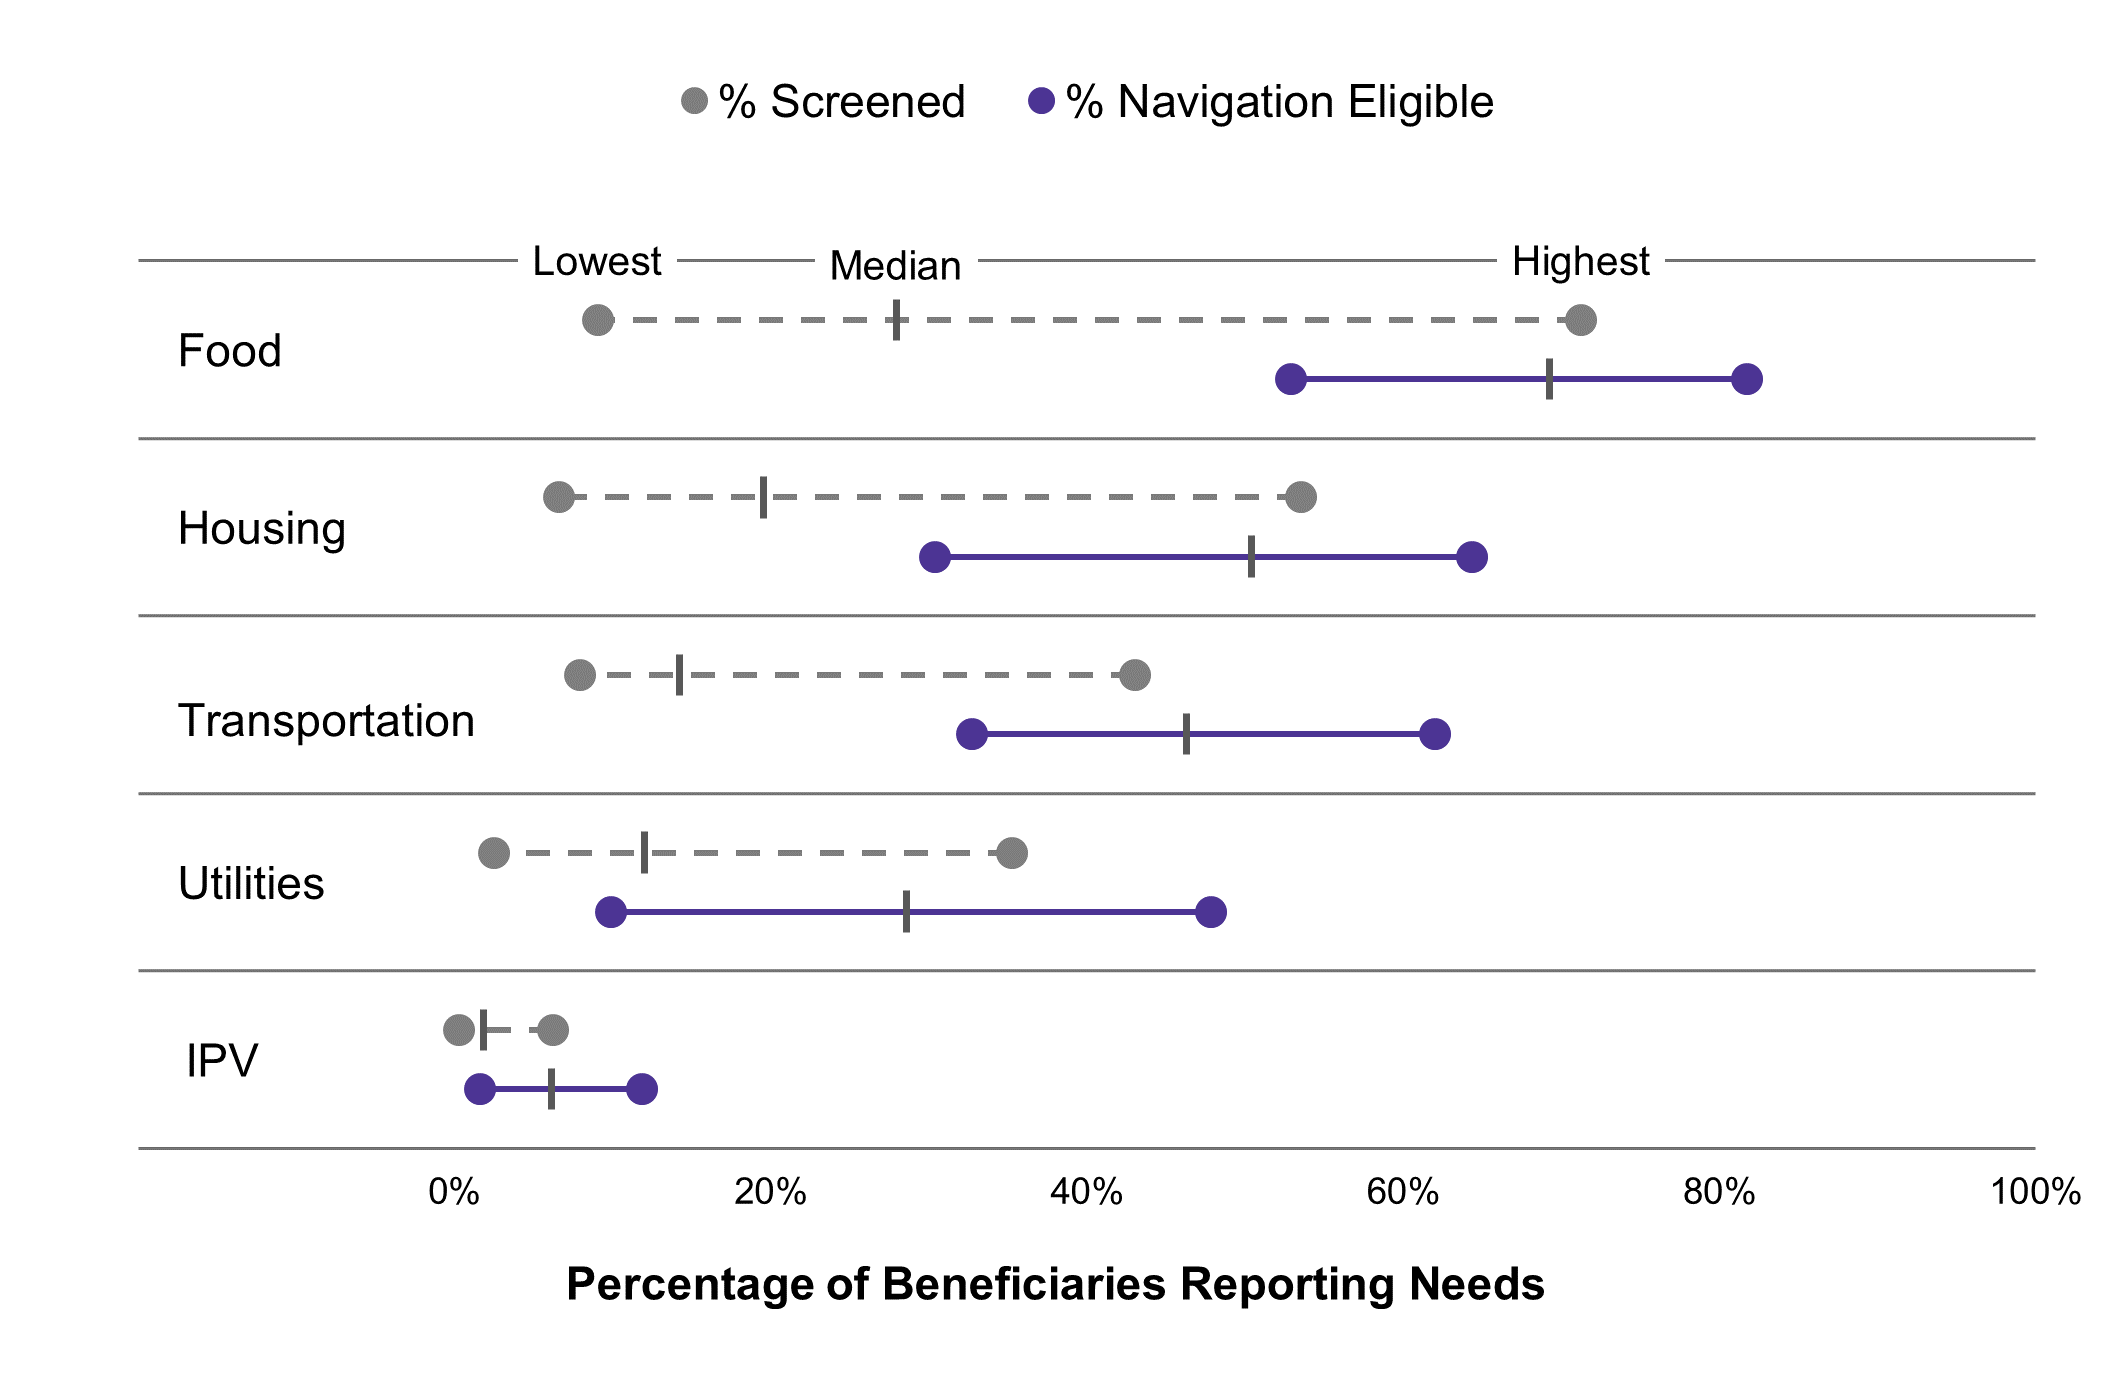
A common percentage axis supports comparison across all five need categories.
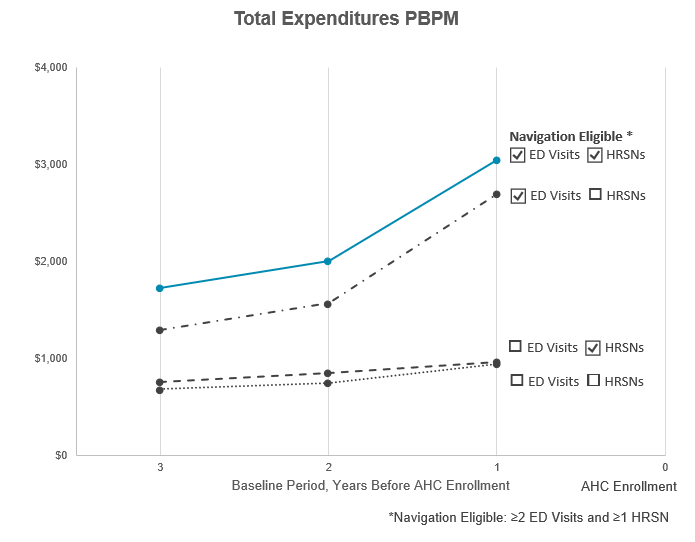
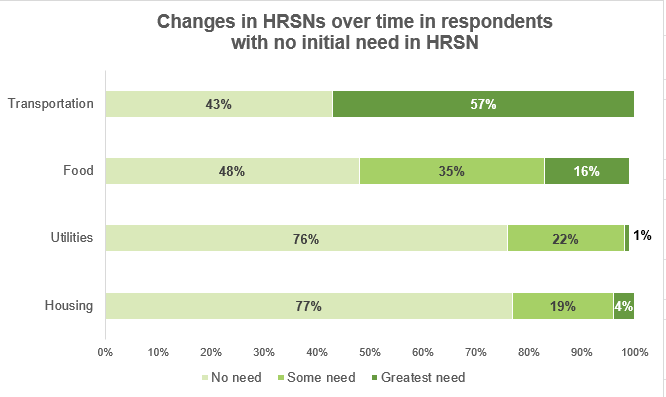
Researchers at RTI had many studies to report to different audiences. The goal: communicate findings clearly in their annual report. A companion style guide kept every graphic cohesive.

Selected project · Accountable Health Communities
Could stronger connections to community supports reduce emergency department use for routine care? I helped researchers communicate findings from a large-scale pilot exploring the relationship between unmet social needs and healthcare use.
The challenge
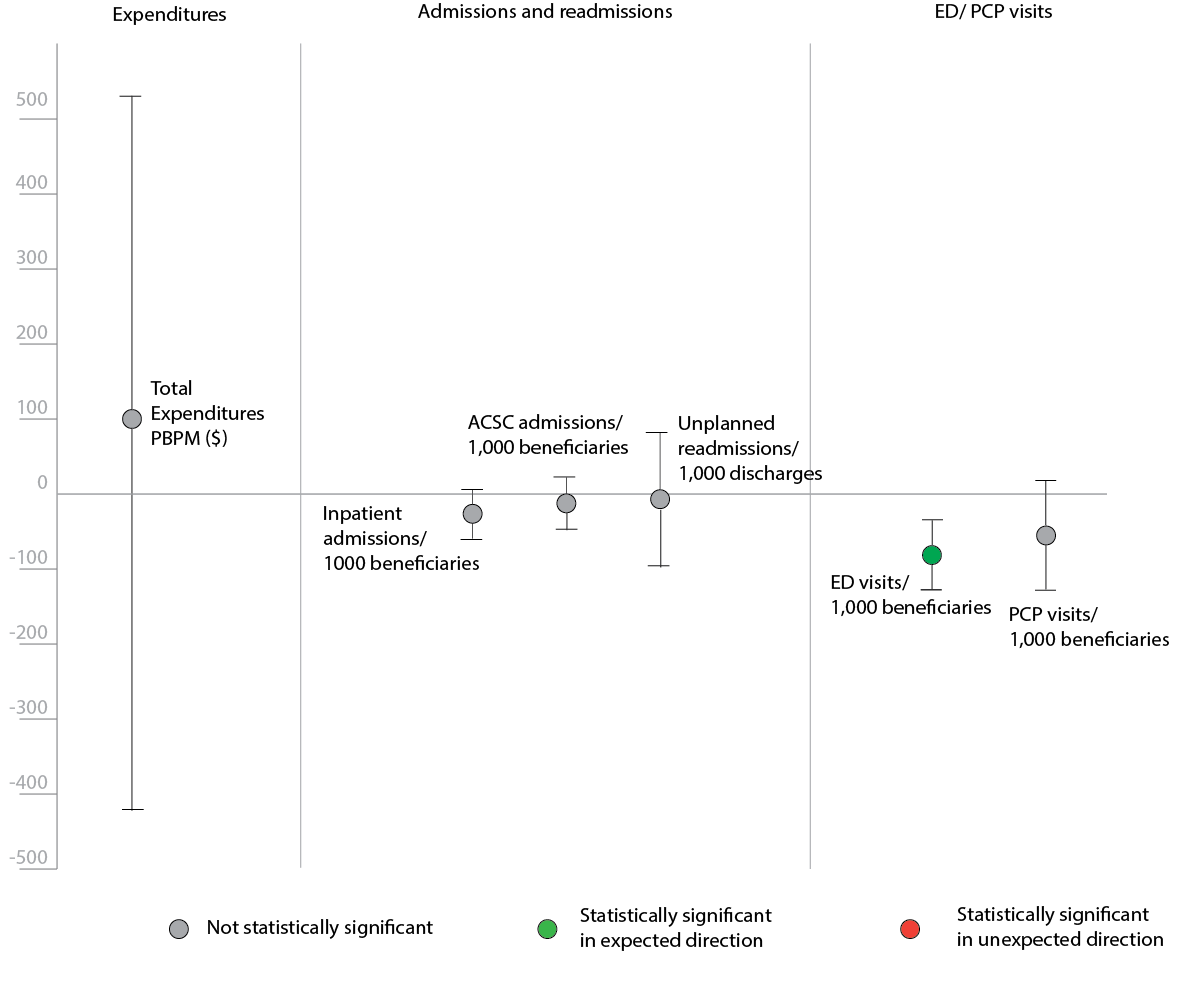
The Accountable Health Communities pilot explored whether connecting people with community supports for needs such as homelessness, food insecurity, and transportation barriers could reduce their reliance on emergency departments for routine care.
COVID-19 disrupted the study and complicated the interpretation of its findings. With large amounts of data and multiple audiences, the research required visual communication that made patterns easier to understand while preserving nuance.
Working through Inciter for RTI International, I led the visual design in close collaboration with researchers. Through iterative reviews, I developed charts, conceptual graphics, and a shared style guide to communicate findings consistently across internal and external reports and presentations.
Community Capacity · Conceptual framework
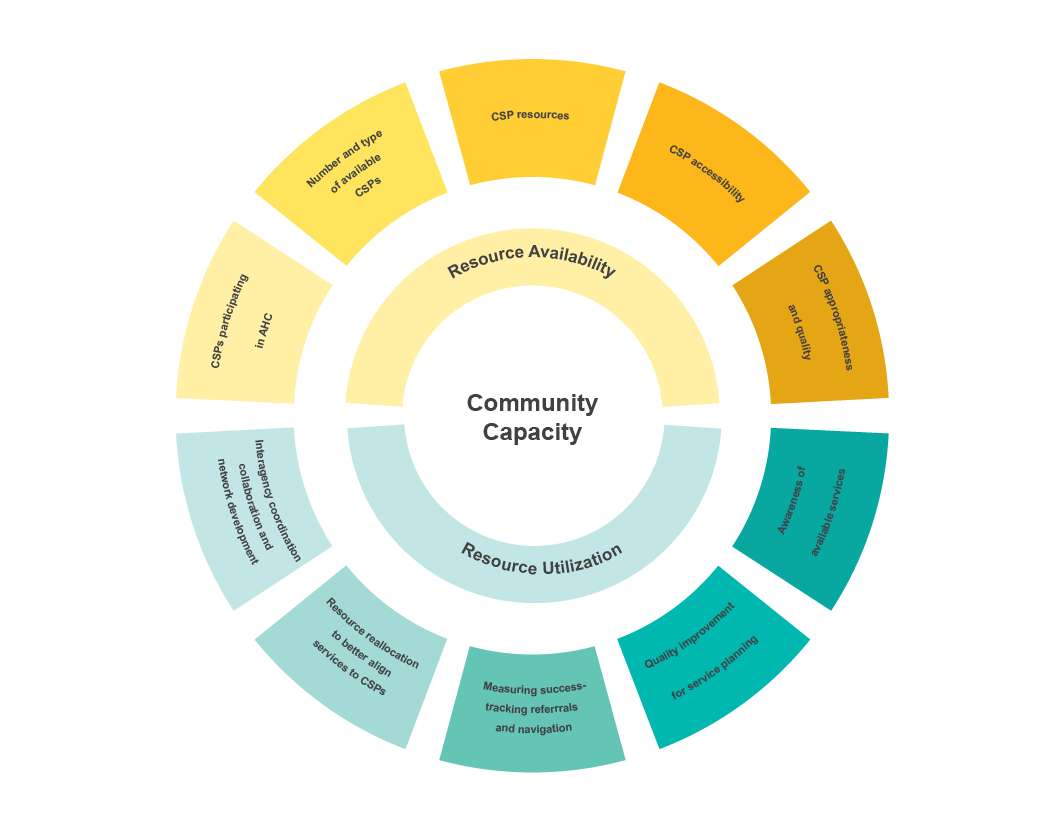
The Community Capacity graphic organizes a detailed framework around two connected dimensions: resource availability and resource utilization. Its visual hierarchy gives readers a way into the individual components without losing sight of the broader concept.
Select the graphic to view it at full size.
Community Capacity anchors the diagram, keeping the central idea visible as readers explore its parts.
Yellow and teal distinguish the two dimensions, linking the inner categories to their outer components.
The structure moves from the overall concept to its dimensions and then to the individual components.
Reported needs · Quantitative comparison
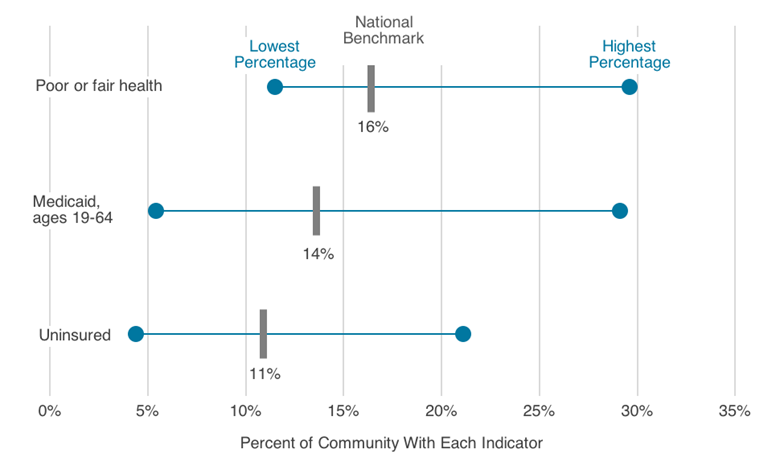
This chart compares the range of reported needs among screened and navigation-eligible beneficiaries. A shared percentage scale lets readers compare food, housing, transportation, utilities, and interpersonal violence (IPV), while the endpoints and median markers retain information about variation.
Select the chart to view it at full size.
A common percentage axis supports comparison across all five need categories.
Color and line style separate the two populations without adding another plotting area.
Lowest, median, and highest values communicate more than a single summary number.
The working relationship
I owned the visual design while working closely with researchers to keep the graphics connected to the findings they needed to communicate.
Researchers supplied the data and findings that informed the visual work.
I translated that material into proposed graphics, making decisions about chart form, hierarchy, labels, and color.
We worked through rounds of feedback to refine the visualizations for their reporting and presentation contexts.
Style guide · Consistency across the work
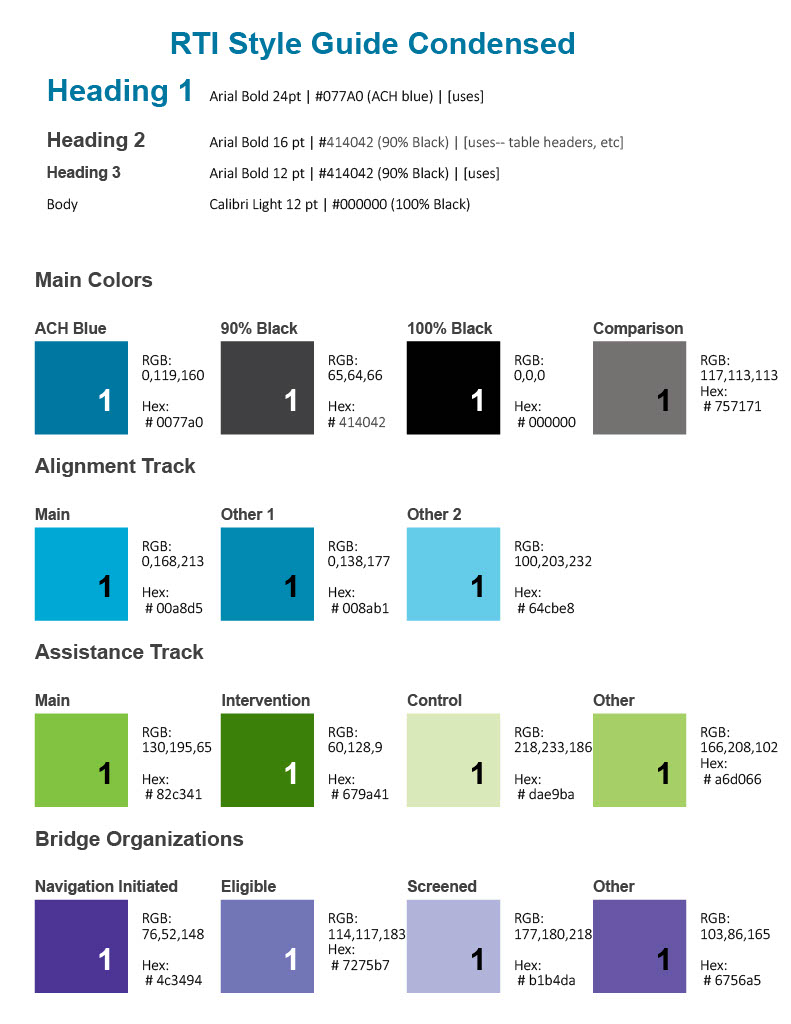
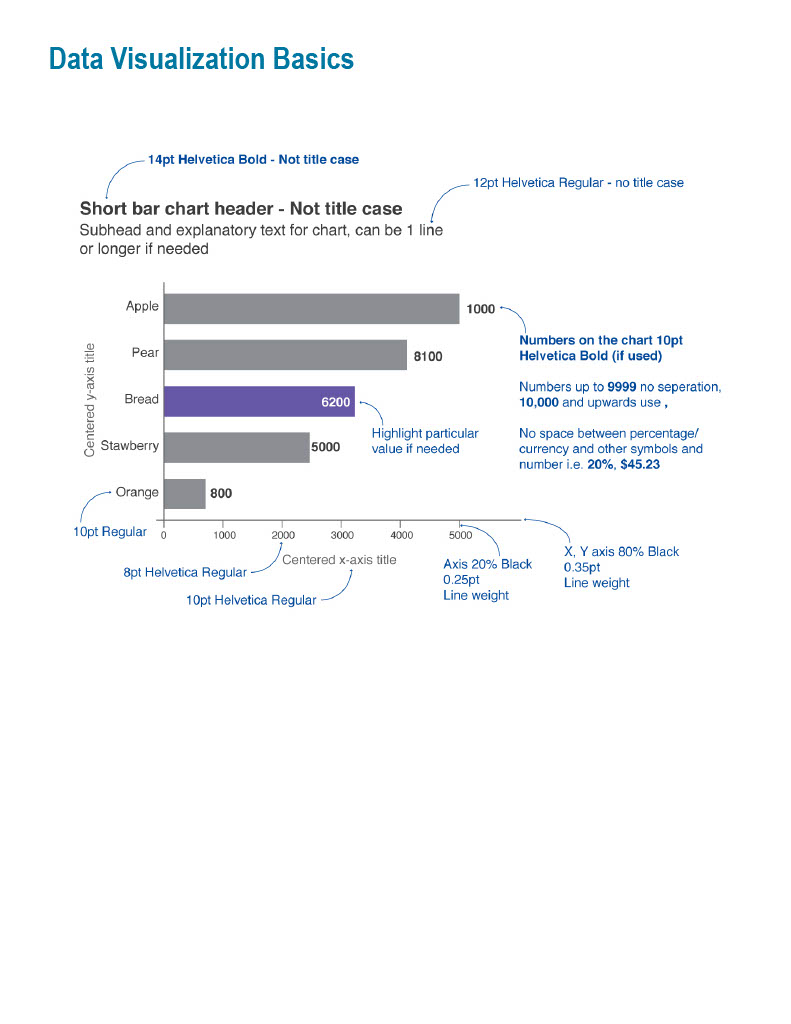
I created a style guide to support consistent communication across a large body of research graphics. It brought typography, color conventions, and chart guidance into one reference.
Type hierarchy and color groupings provide a common foundation for different kinds of content.
An annotated example makes the treatment of titles, labels, axes, and emphasis explicit.
The outcome
The work produced graphics used in reports and presentations for internal and external audiences, alongside a style guide that documented consistent design conventions. Together, these pieces show how I approach both the individual visual explanation and the system that connects the work.
Accountable Health Communities · Completed through Inciter for RTI International.